Insights on analytics, data-driven decision-making, and applied research.
Predictive Analytics & Operations
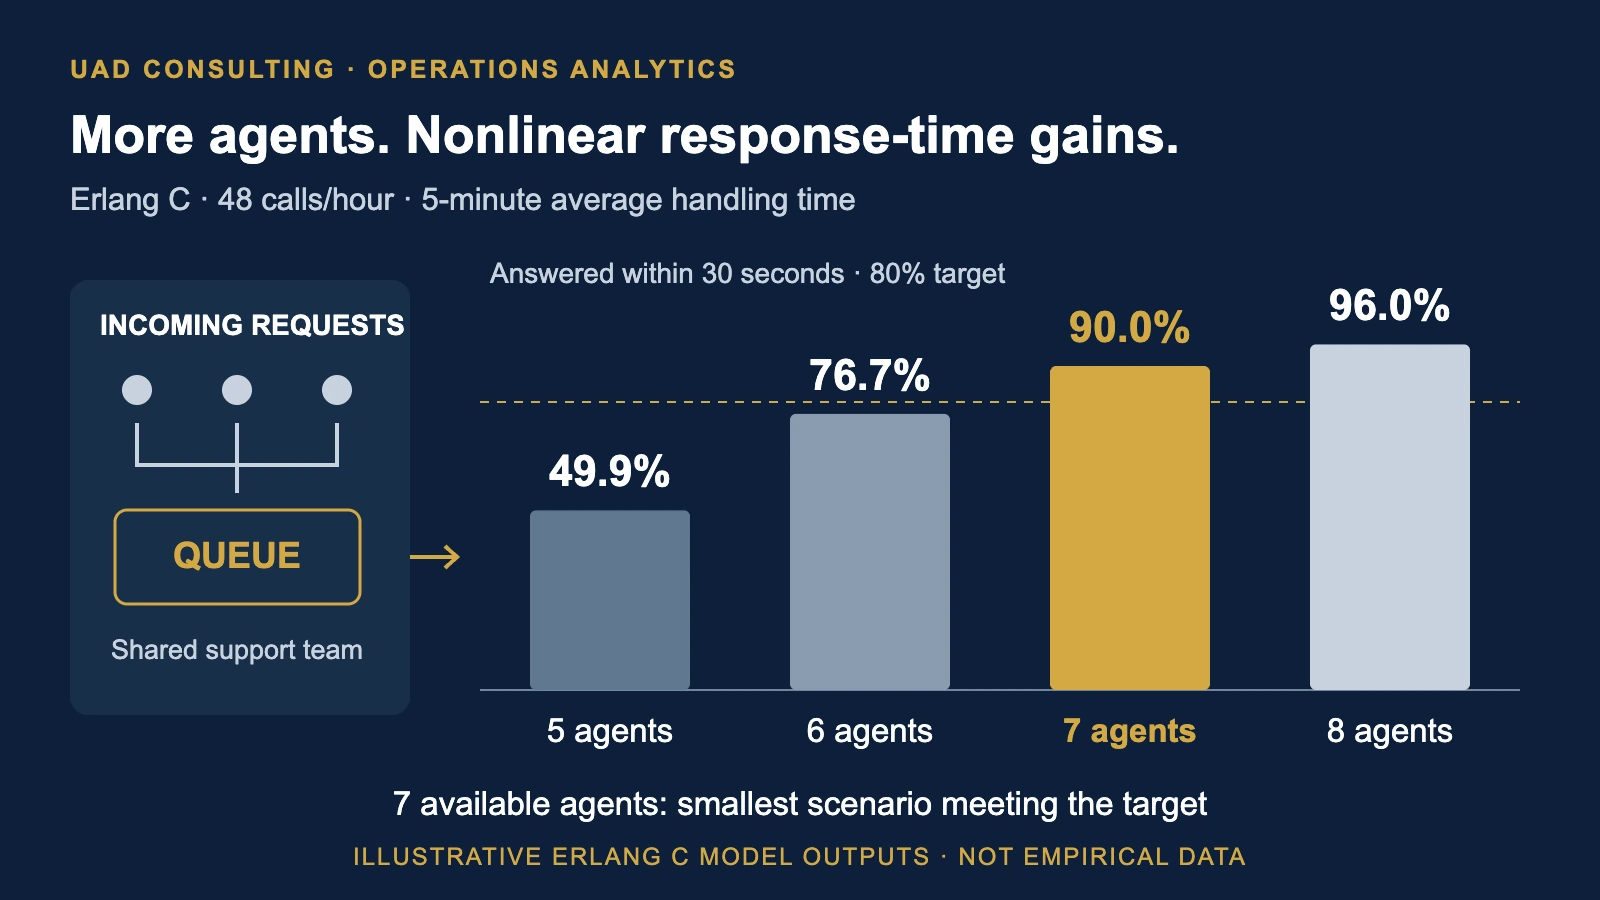
How Many Support Agents Do You Need to Meet a Response-Time Target?
How many support agents does your business actually need? Explore how queueing theory, Erlang C, response-time targets, and labor costs help turn demand forecasts into staffing decisions.
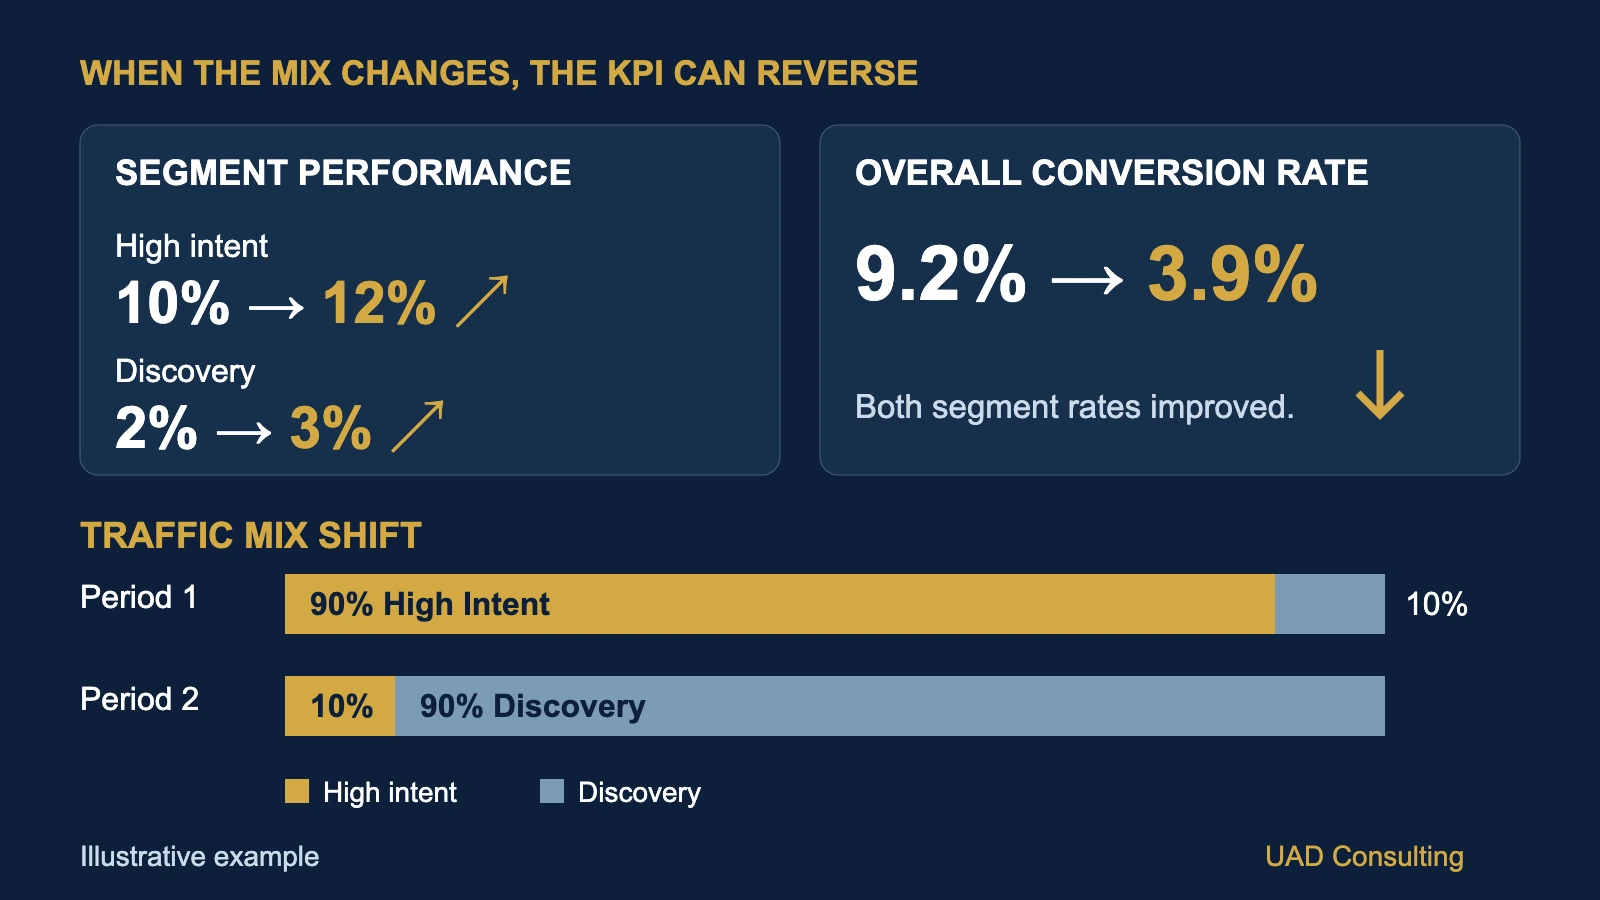
Why Did Overall Conversion Rate Fall When Every Segment Improved?
A declining conversion rate does not always mean performance deteriorated. Learn how traffic mix, weighted averages, and Simpson's paradox can change the story behind a business KPI.
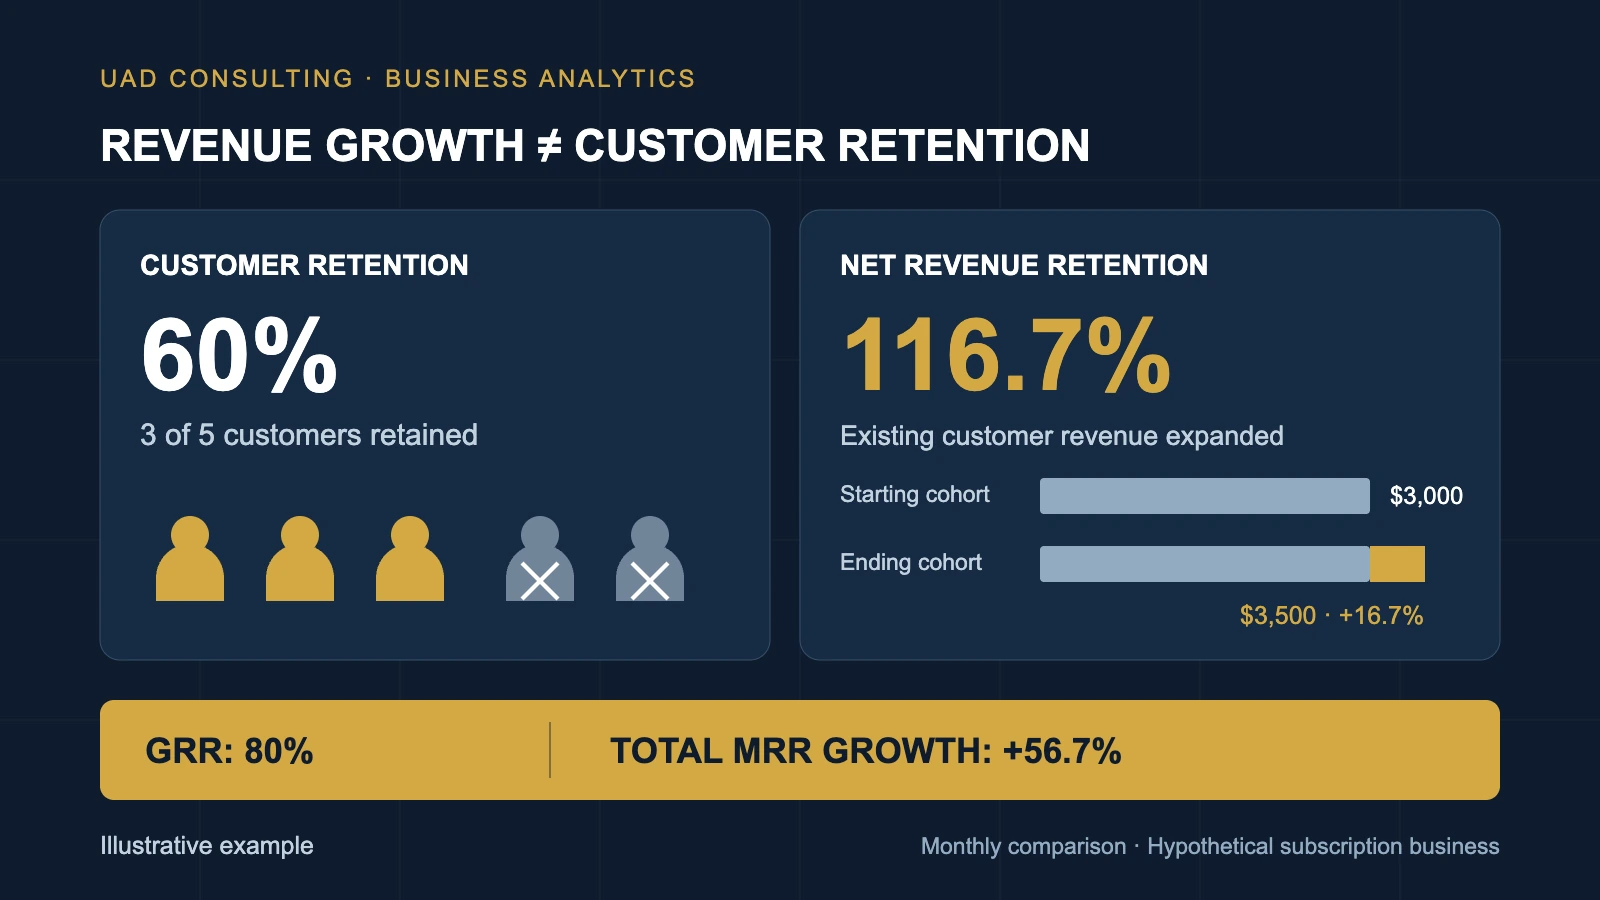
Revenue Is Growing. Why Are We Still Losing Customers?
Strong revenue growth can conceal customer losses. Learn how net revenue retention, gross retention, and customer churn reveal different dimensions of business performance.
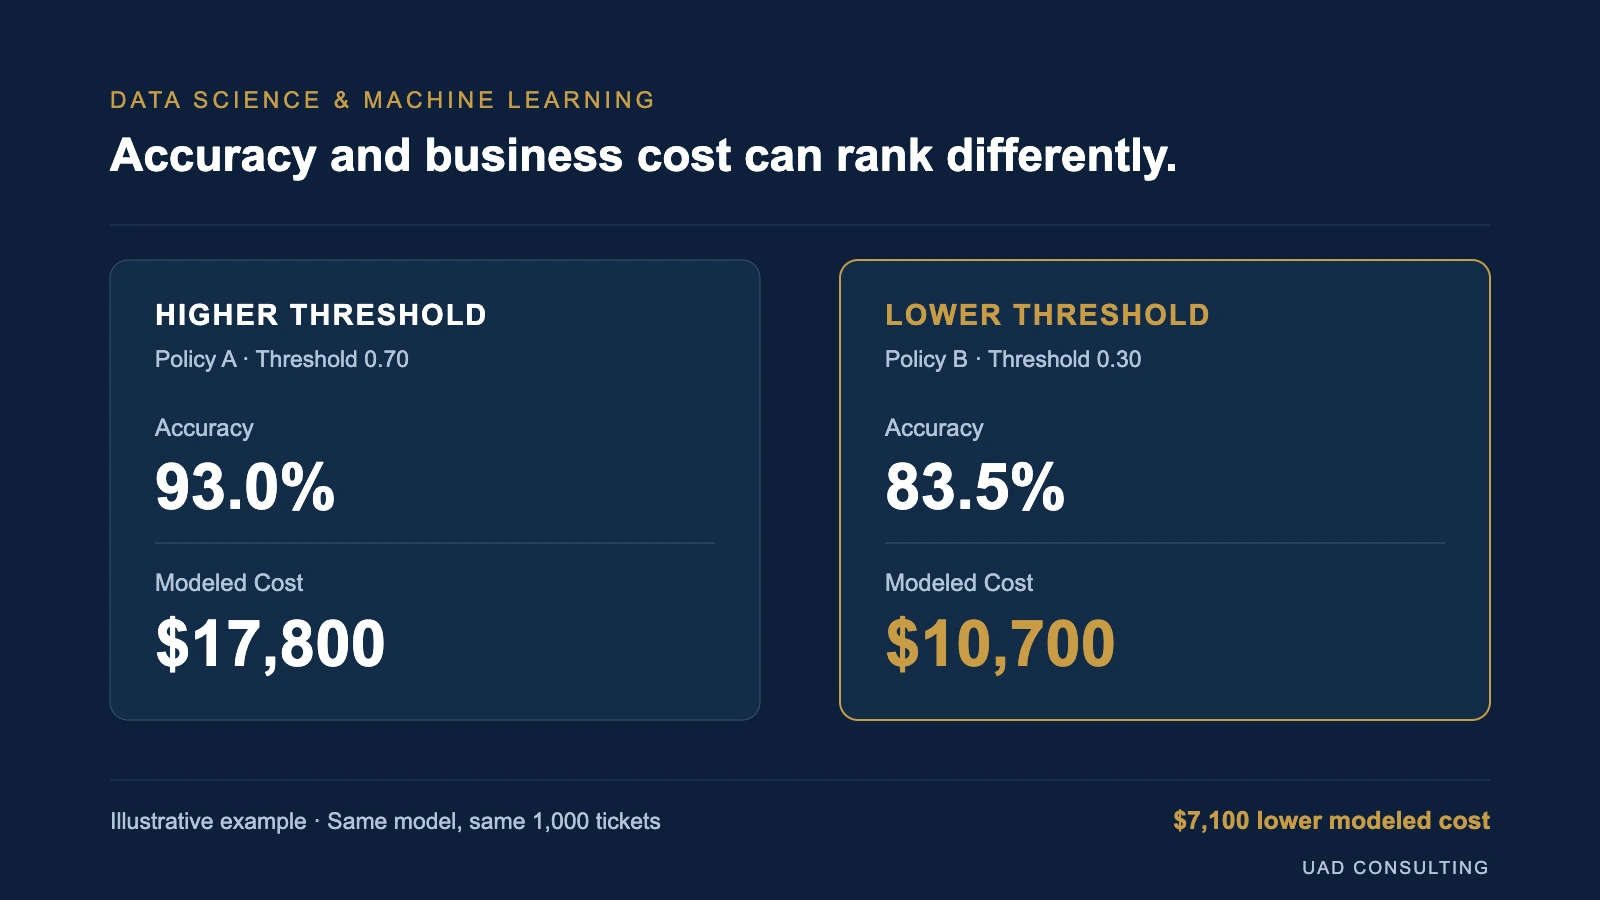
Why Can a Lower-Accuracy Classification Threshold Save More Money?
A classifier can achieve higher accuracy while producing more expensive decisions. Learn how decision thresholds, error costs, and operational capacity change model value.
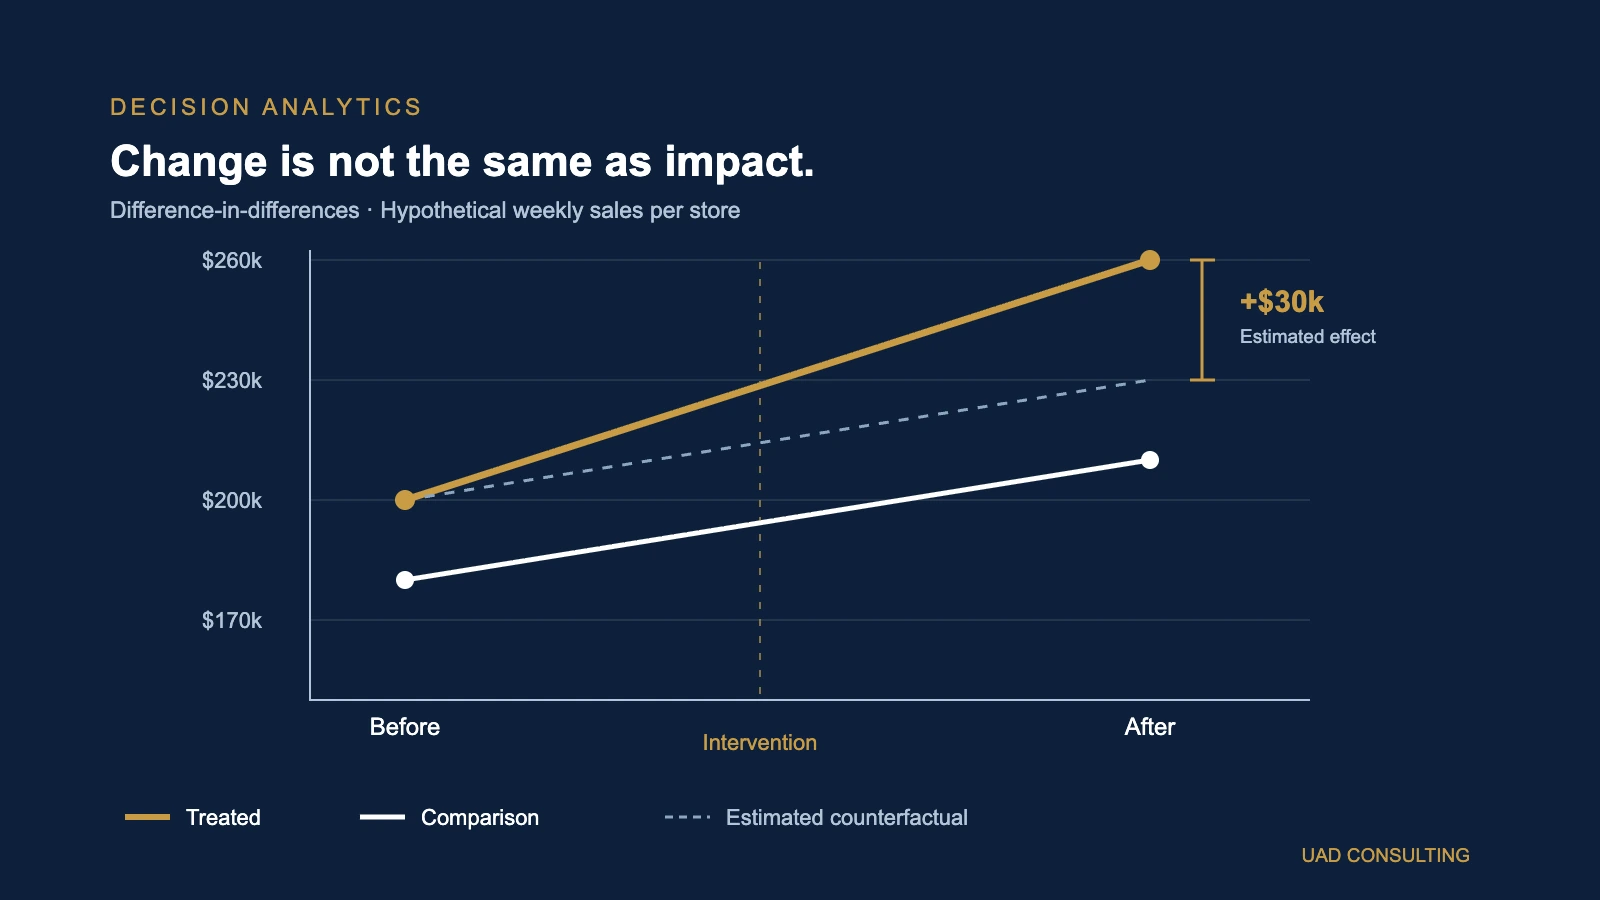
Did the Change Actually Work? Measuring Business Impact Without an A/B Test
A business metric improved after a change. Did the change cause it? Learn how difference-in-differences uses comparison groups, counterfactual reasoning, and practical checks to evaluate impact without randomized experiments.
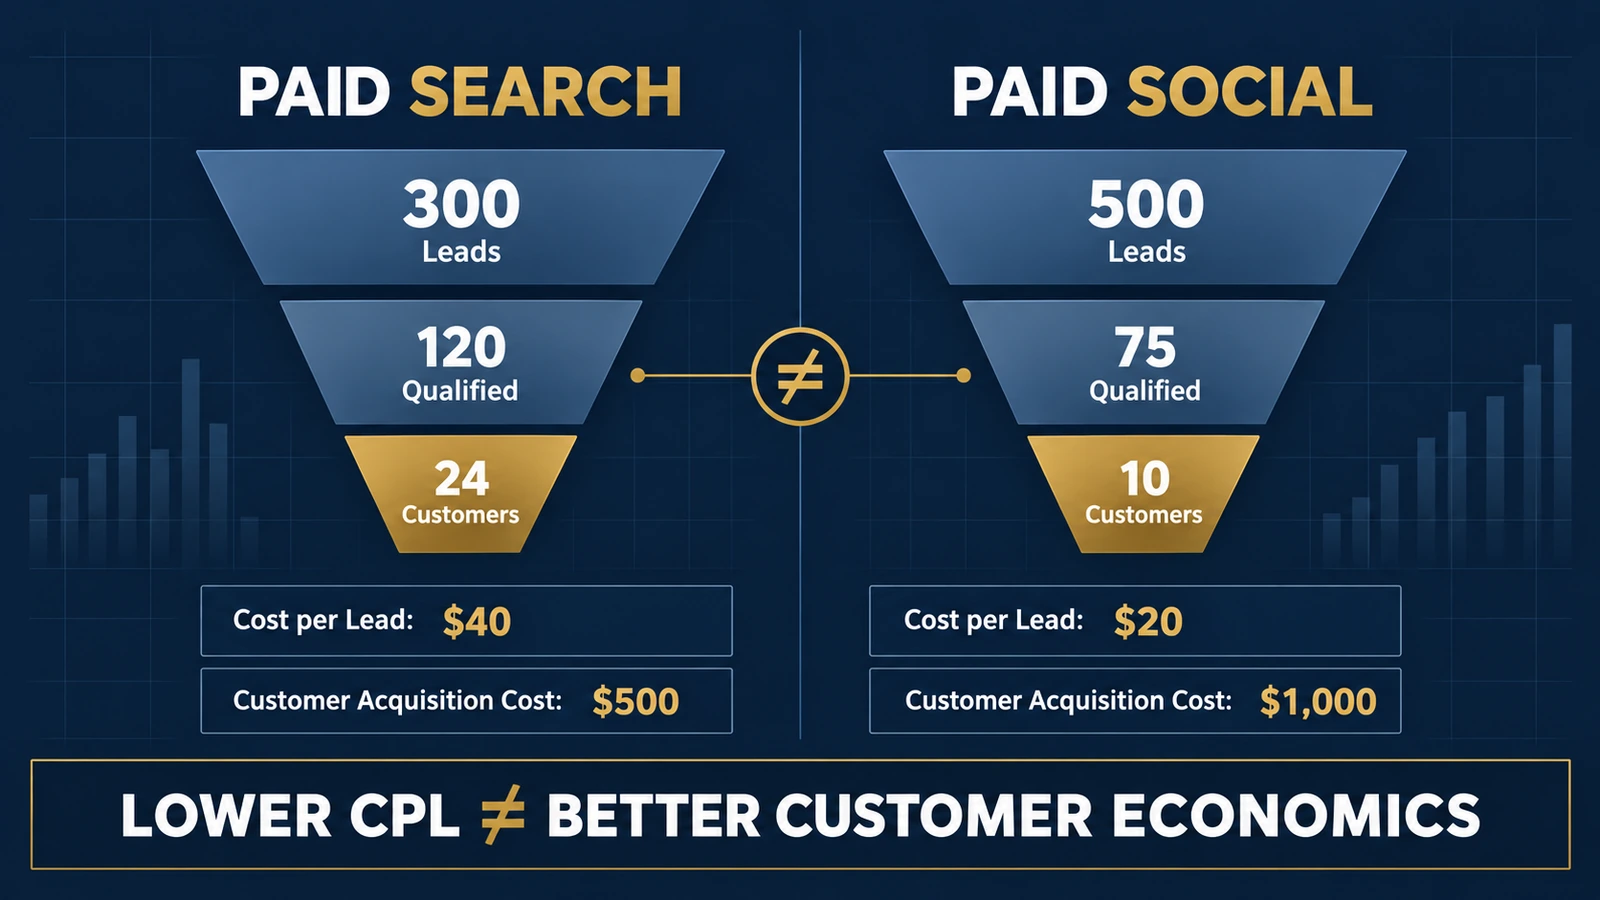
Why Is Cost per Lead Falling While Customer Acquisition Cost Rises?
Cheaper leads do not always mean cheaper customers. Learn how lead quality, CRM conversion tracking, and acquisition economics can change marketing decisions.
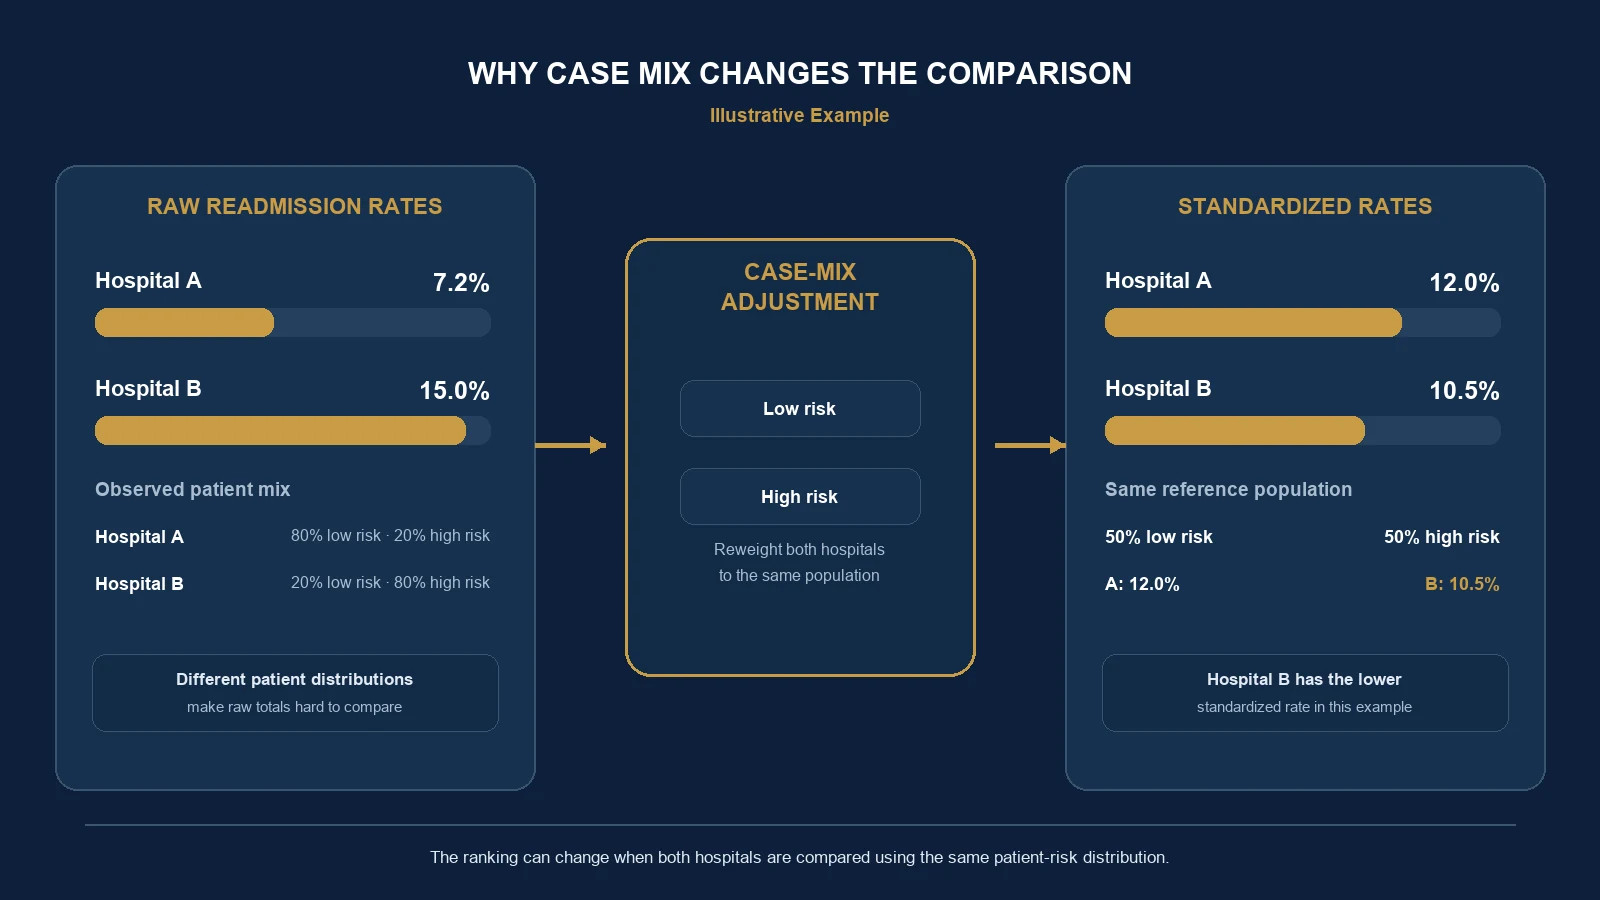
Which Hospital Has Better Readmission Outcomes? Why Raw Rates Can Mislead
A hospital with a higher raw readmission rate may perform better after accounting for patient risk. Explore case-mix adjustment through a worked comparison.
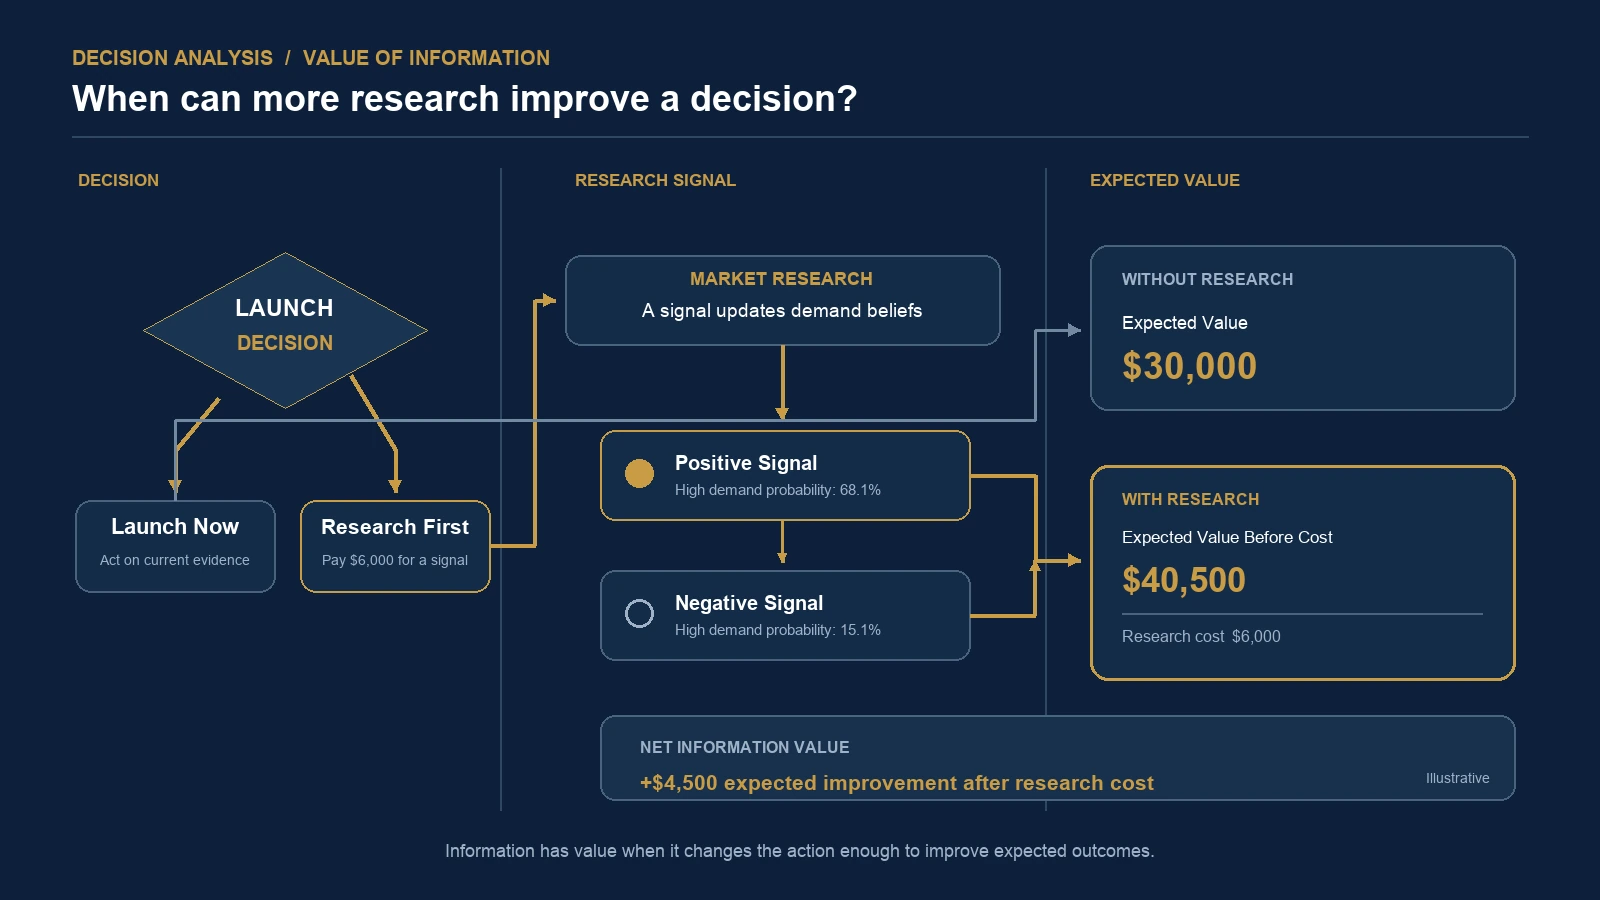
Should You Pay for More Research Before Making a Business Decision?
More research is not always worth the cost. Learn how EVPI, EVSI, and decision thresholds help determine whether better information can improve a business decision.
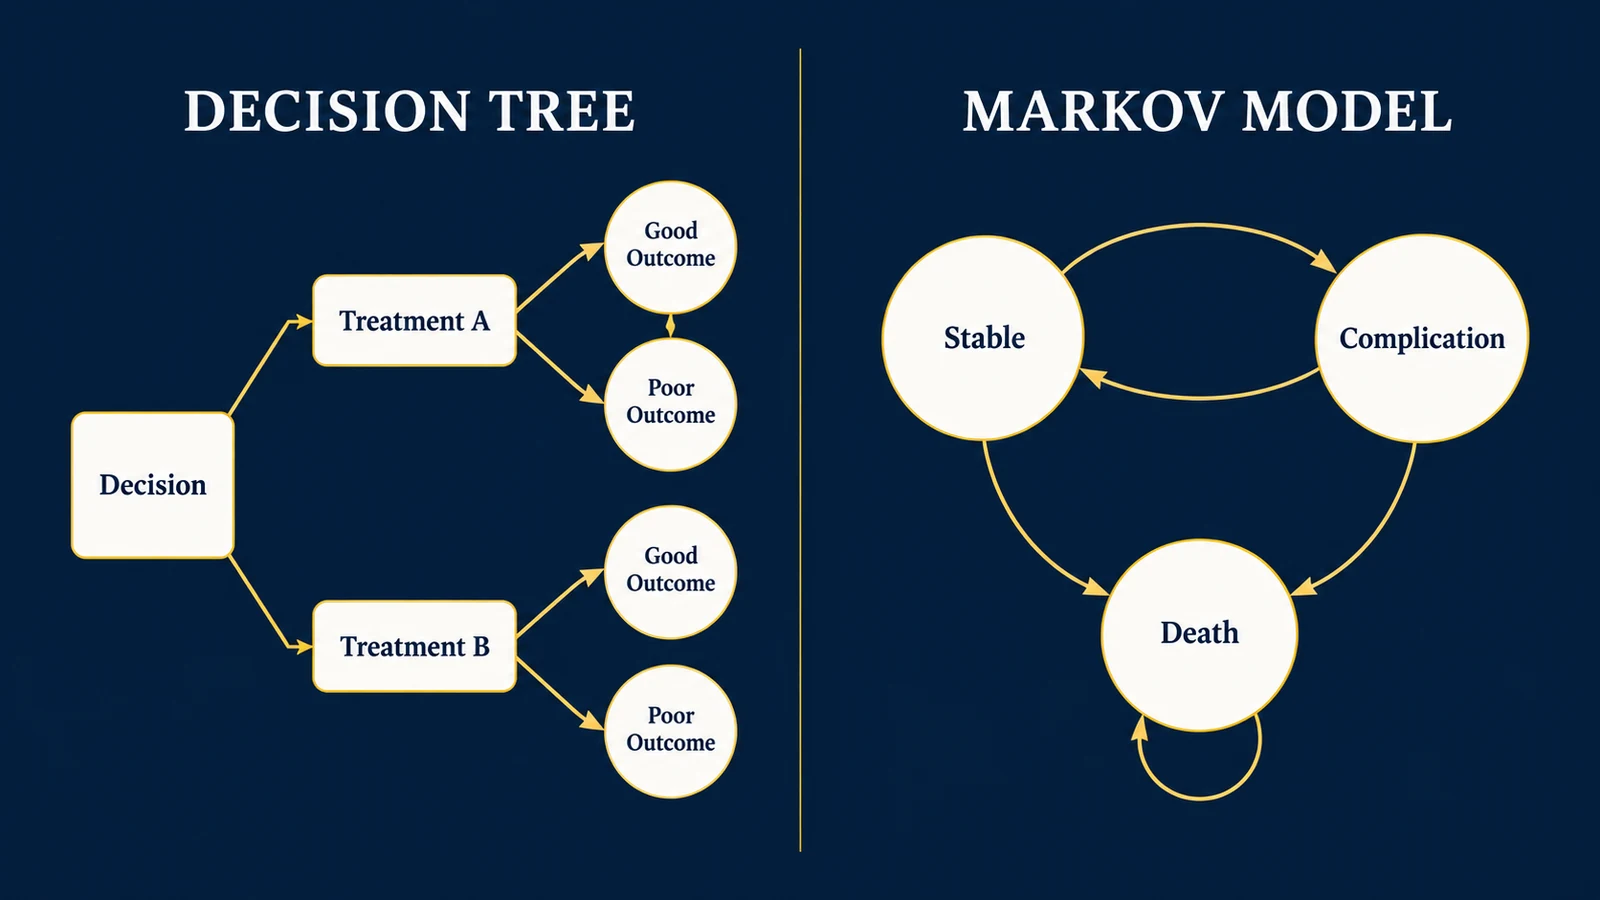
Decision Tree vs. Markov Model: Which Should You Use for Healthcare Cost-Effectiveness Analysis?
When should healthcare cost-effectiveness studies use a decision tree or Markov model? Compare methods through a worked example with costs, QALYs, and ICERs.
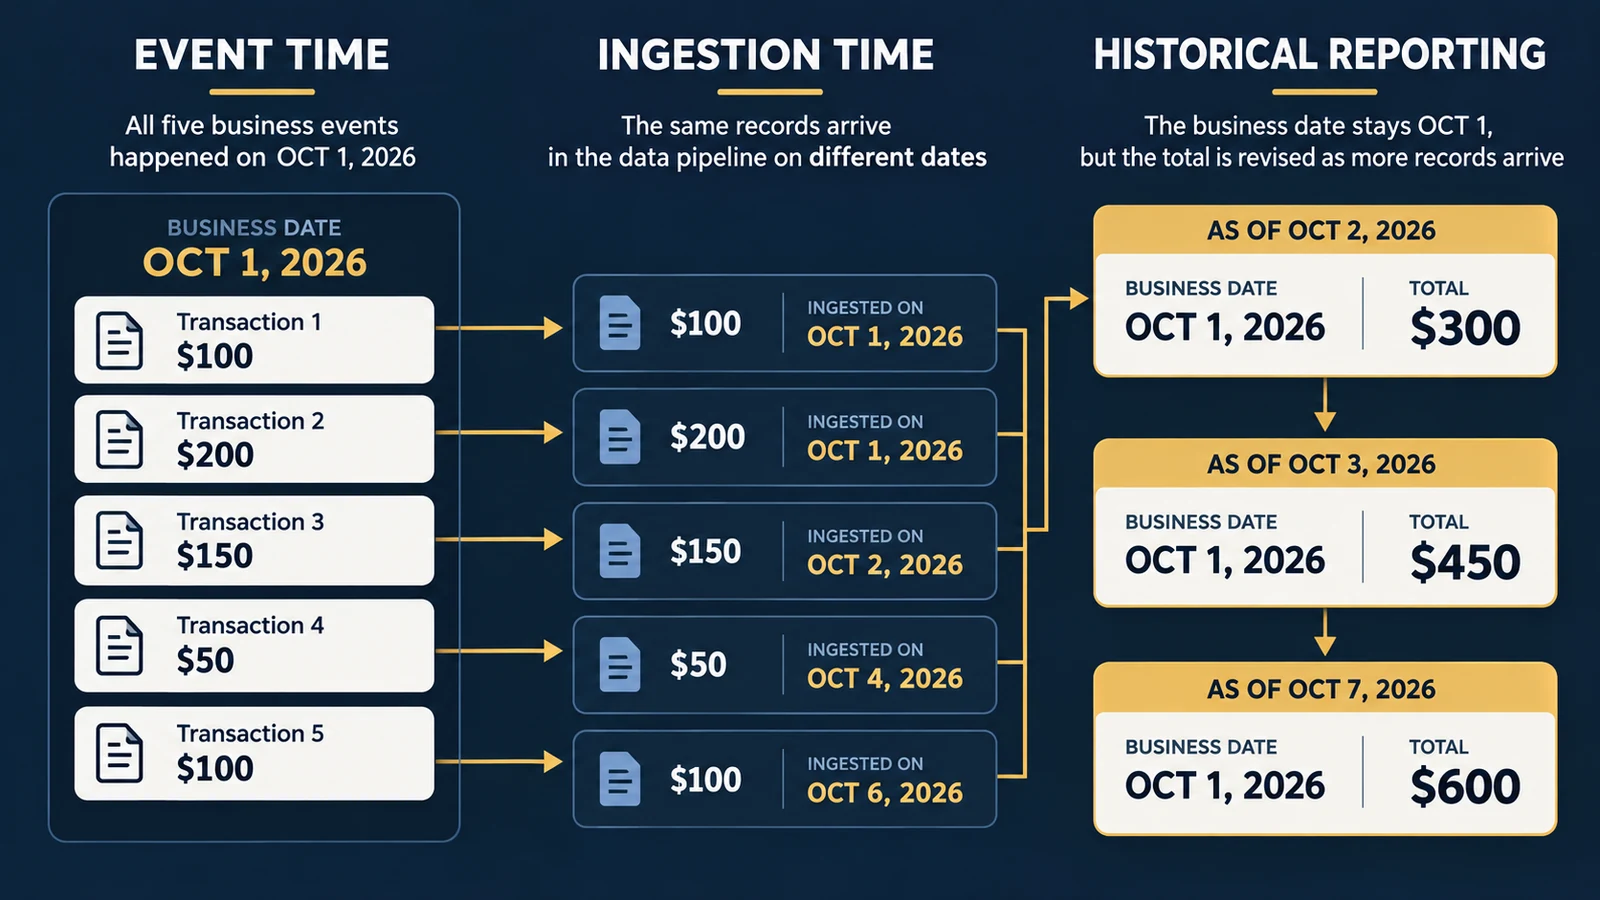
Why Did Yesterday’s Revenue Change? Late-Arriving Data, Backfills, and Reporting Cutoffs
Historical dashboard totals can change when transactions arrive late or source records are corrected. Learn how reporting cutoffs, backfills, and SQL make those revisions explainable.
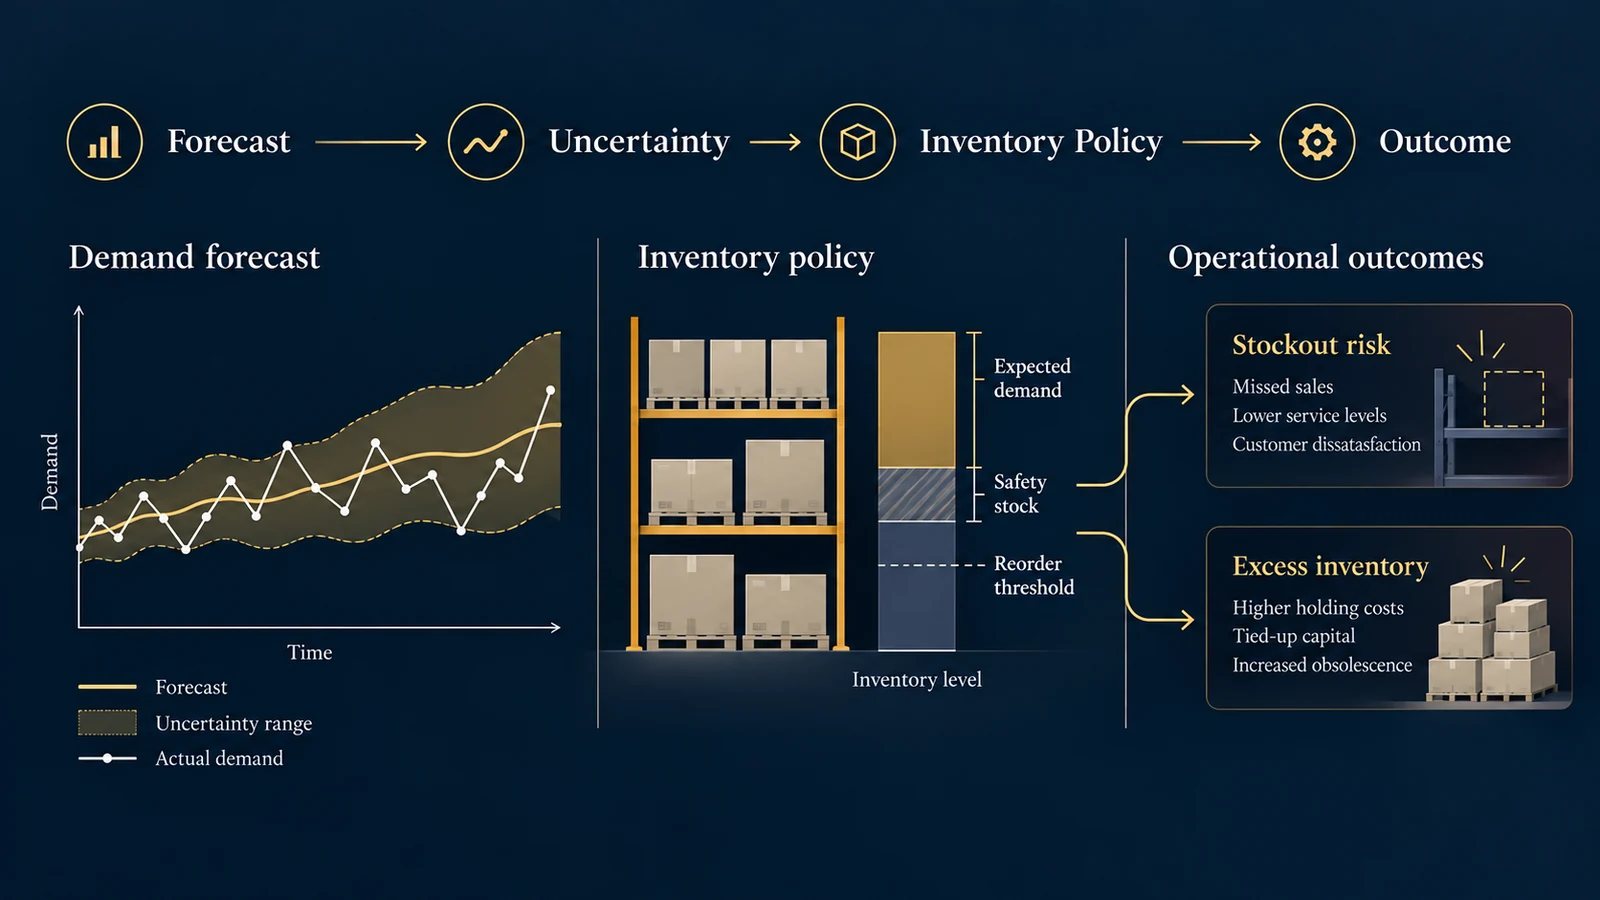
Why Do Accurate Demand Forecasts Still Lead to Stockouts?
Accurate demand forecasts can still lead to stockouts. Learn how forecast uncertainty, safety stock, lead times, and reorder points shape inventory decisions.