A subscription business finishes the month with higher recurring revenue than it started with.
Management celebrates.
The revenue dashboard is green. Monthly recurring revenue is increasing, existing accounts are purchasing additional services, and the company's net revenue retention rate exceeds 100%.
Yet the customer success team reports something less encouraging.
Customers are leaving.
In fact, the business is losing a substantial percentage of its existing customer accounts.
How can both observations be correct?
Because revenue retention and customer retention measure different things.
A business can lose customers while generating more revenue from the customers who remain.
That may reflect successful expansion into larger accounts. It may also conceal a retention problem that deserves management attention.
The distinction matters because a growing revenue total does not necessarily mean the underlying customer base is becoming healthier.
Understanding the difference requires examining several related metrics rather than relying on one headline number.
The Short Answer: Revenue Growth Can Hide Customer Churn
Revenue growth measures how much a company's revenue base increases.
Customer retention measures how many existing customers remain.
Net revenue retention measures how much recurring revenue is retained from an existing customer cohort after accounting for expansion, contraction, and churn.
These metrics answer different questions.
A company can achieve net revenue retention above 100% even while losing customers.
This happens when expansion revenue from retained customers exceeds revenue lost through cancellations and downgrades.
Consider three simplified outcomes:
- Customer count declines.
- Existing customers increase their spending.
- Total recurring revenue grows.
There is no mathematical contradiction.
The business is generating more revenue from fewer retained customers.
Whether this represents a healthy business depends on the concentration, sustainability, profitability, and causes of that growth.
The central analytical lesson is simple:
Revenue retention should not be interpreted as customer retention.
Four Metrics That Should Not Be Confused
Before examining the numbers, we need to distinguish four related measurements.
1. Customer Retention Rate
Customer retention rate, sometimes called logo retention in business-to-business subscription analytics, measures the percentage of existing customer accounts that remain active at the end of a period.
Suppose a business begins the month with 100 paying customers.
At the end of the month, 85 of those original customers remain.
Customer retention is:
85 / 100 × 100 = 85%
The 15 customers who left represent a 15% customer churn rate.
New customers acquired during the month do not count as retained customers from the original cohort.
This metric focuses on customer relationships, not the revenue associated with them.
2. Gross Revenue Retention (GRR)
Gross revenue retention measures how much recurring revenue the business retains from its starting customer base before counting expansion revenue.
The standard formula is:
MRR means monthly recurring revenue.
Churned MRR represents recurring revenue lost when existing customers cancel.
Contraction MRR represents recurring revenue lost when existing customers downgrade or reduce their subscriptions.
GRR excludes expansion revenue.
It also excludes revenue from newly acquired customers.
Under the standard definition, GRR cannot exceed 100%.
A GRR of 85% means the business retained 85% of its starting recurring revenue before considering upgrades or expansion.
This makes GRR useful for evaluating how much existing revenue is being lost.
3. Net Revenue Retention (NRR)
Net revenue retention includes expansion revenue from the starting customer cohort.
Expansion MRR includes additional recurring revenue generated by existing customers through upgrades, additional subscriptions, or other qualifying expansions.
NRR excludes revenue from customers acquired after the beginning of the measurement period.
Unlike GRR, NRR can exceed 100%.
An NRR of 110% means recurring revenue from the original customer cohort increased by 10% over the measurement period.
It does not mean 110% of customers were retained.
4. Total MRR Growth
Total monthly recurring revenue growth compares the entire recurring revenue base at the beginning and end of the period.
Unlike NRR, total MRR growth includes revenue from newly acquired customers.
This distinction is important.
NRR evaluates revenue movement within an existing customer cohort.
Total MRR growth evaluates the company's overall recurring revenue base.
The two metrics can move in different directions.
A Worked Example: Revenue Growth With Customer Losses
Consider a hypothetical subscription analytics business with five paying customers at the beginning of September 2026.
The business offers recurring analytical software and reporting subscriptions.
Each customer pays a different monthly amount.
During September, some customers upgrade, others cancel, and two new customers join.
For simplicity, assume:
- All amounts represent normalized monthly recurring revenue in US dollars.
- Customer accounts are uniquely identified.
- No customer changes currency.
- No refunds or one-time charges are included.
- All starting customers were active at the beginning of the period.
- No customer cancels and reactivates during the measurement window.
- September's ending snapshot accurately reflects active recurring subscriptions.
These are hypothetical values created to illustrate the analytical relationships.
Starting Customer Cohort
| Customer | Starting MRR | Ending MRR | Change |
|---|---|---|---|
| A | $1,000 | $1,800 | +$800 |
| B | $800 | $1,100 | +$300 |
| C | $600 | $600 | $0 |
| D | $400 | $0 | -$400 |
| E | $200 | $0 | -$200 |
| Total | $3,000 | $3,500 | +$500 |
At the beginning of September, the company had five customers generating $3,000 MRR.
By the end of September:
Customer A expanded spending by $800.
Customer B expanded spending by $300.
Customer C maintained the same subscription.
Customers D and E canceled.
The original customer cohort now generates $3,500 MRR.
Revenue from the original cohort increased.
But two of the five customers disappeared.
Let's calculate what each metric reports.
Step 1: Calculate Customer Retention
The company began with five customers.
Three remain active.
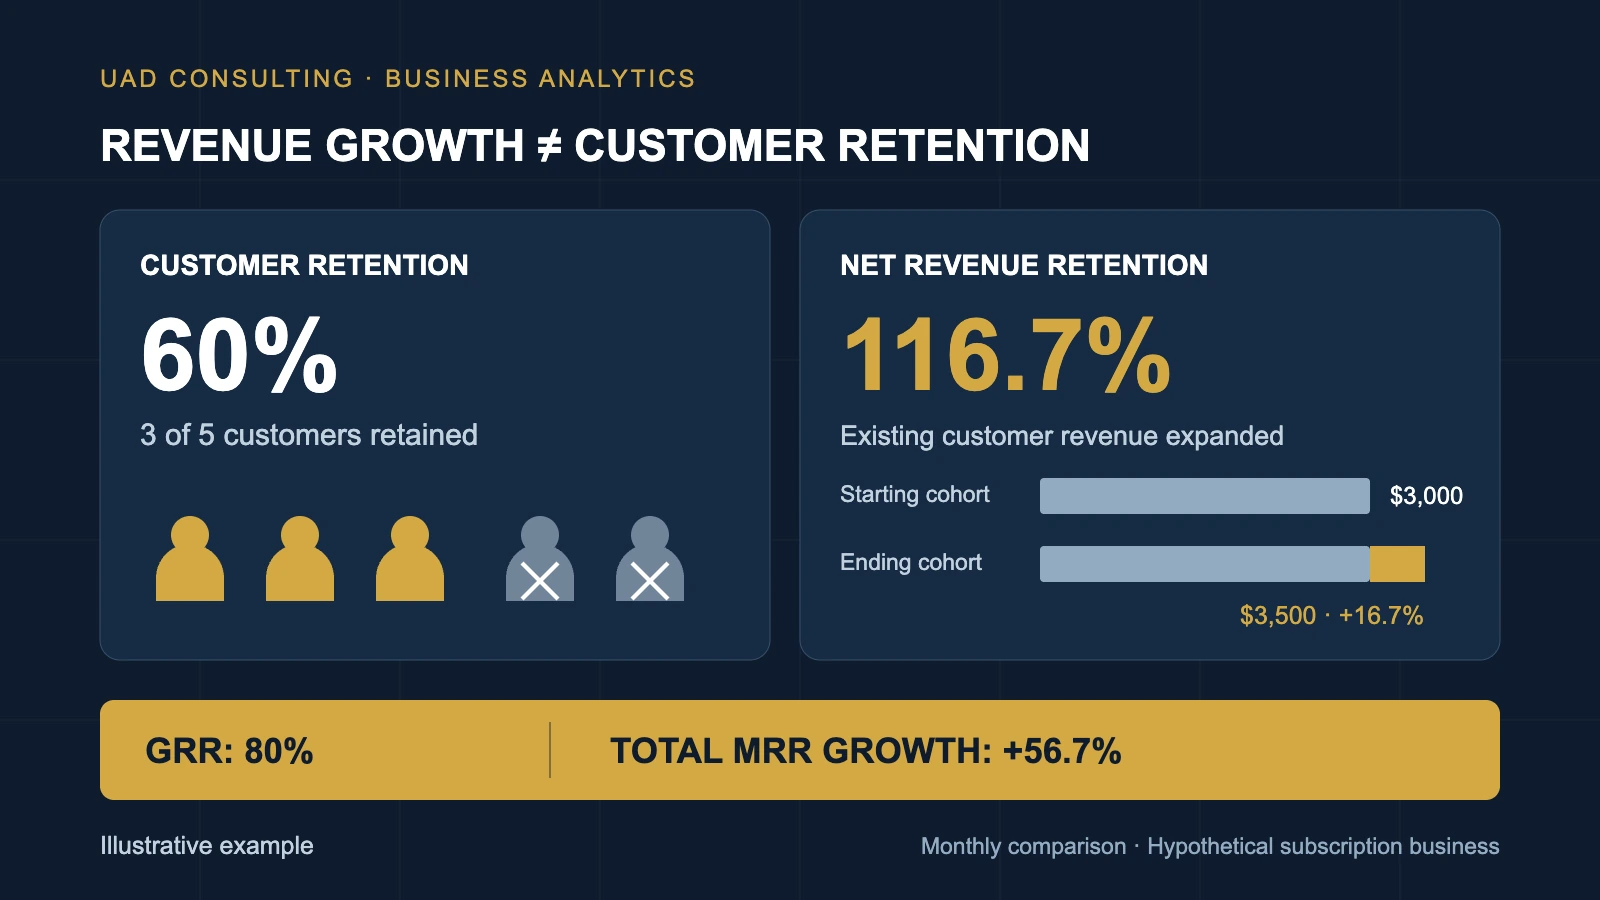
The company retained only 60% of its starting customer accounts.
This is a substantial loss of customer relationships in the hypothetical example.
Yet the recurring revenue associated with the original customer cohort increased.
That is the central contradiction that different retention metrics help explain.
Step 2: Calculate Gross Revenue Retention
Starting MRR:
$3,000
Churned MRR:
Customer D: $400 Customer E: $200
Total churned MRR:
$600
There were no downgrades among the remaining customers.
Therefore:
Contraction MRR = $0
The company retained 80% of its original recurring revenue before counting expansion.
This tells management something that customer retention alone cannot.
Although 40% of customers left, those customers represented only 20% of the original recurring revenue.
The lost customers were smaller accounts.
This distinction matters for revenue exposure and customer segmentation.
However, the lower revenue contribution of departing customers does not make their departure irrelevant.
Customer losses may still indicate problems with onboarding, product fit, pricing, service quality, or competition.
The example does not establish which of those explanations applies.
Step 3: Calculate Net Revenue Retention
Now include expansion revenue.
Customer A increased MRR by $800.
Customer B increased MRR by $300.
Total Expansion MRR:
$800 + $300 = $1,100
Starting MRR:
$3,000
Expansion MRR:
$1,100
Churned MRR:
$600
Contraction MRR:
$0
The company achieved 116.7% net revenue retention.
This means the starting customer cohort generated approximately 16.7% more recurring revenue at the end of the period than at the beginning.
Yet customer retention was only 60%.
Both results are mathematically correct.
They describe different dimensions of the business.
Step 4: Add New Customers
Suppose the company also acquired two new customers during September.
Customer F subscribes for $700 MRR.
Customer G subscribes for $500 MRR.
New MRR:
$700 + $500 = $1,200
The company's total ending MRR is:
$3,500 from the original cohort + $1,200 from new customers
= $4,700
Starting MRR was $3,000.
The company can therefore report 56.7% total MRR growth.
That growth includes both expansion from existing customers and revenue from newly acquired customers.
It should not be confused with NRR.
Four Correct Numbers, Four Different Stories
The final scorecard looks like this:
| Metric | Result | Interpretation |
|---|---|---|
| Customer retention | 60.0% | Three of five starting customers remain |
| Customer churn | 40.0% | Two of five starting customers left |
| Gross revenue retention | 80.0% | 20% of starting MRR was lost |
| Net revenue retention | 116.7% | Expansion exceeded revenue losses |
| Total MRR growth | 56.7% | Overall recurring revenue increased |
None of these metrics is necessarily wrong.
The problem arises when management interprets one as a substitute for another.
A dashboard displaying only total MRR growth might suggest the company is performing exceptionally well.
A dashboard displaying only customer churn might suggest the business is struggling.
A dashboard displaying only NRR might conceal how many customer relationships have ended.
A more useful dashboard shows the metrics together.
Why High NRR Can Conceal a Retention Problem
Net revenue retention is valuable because it captures expansion and contraction within an existing customer base.
However, it is an aggregate revenue metric.
It does not reveal how evenly growth is distributed across customers.
In our example, two expanding accounts more than offset the revenue lost from two departing accounts.
This creates three potential analytical concerns.
Revenue Concentration
At the beginning of the period, Customer A represented:
$1,000 / $3,000 = 33.3%
of the starting cohort's MRR.
At the end of the period, Customer A represents:
$1,800 / $3,500 = 51.4%
of the remaining cohort's MRR.
The original cohort has become more dependent on one customer.
The business may be generating more revenue while simultaneously becoming more exposed to the spending decisions of a small number of accounts.
That is not automatically undesirable.
Large customers can be profitable, stable, and strategically important.
But concentration risk should be measured rather than hidden inside a favorable NRR figure.
Uneven Customer Experience
Expansion from large customers does not establish that smaller customers are satisfied.
Different customer segments may experience the product differently.
For example, larger accounts may benefit from dedicated support, custom integrations, or advanced features.
Smaller customers may face different constraints.
The aggregate NRR calculation does not identify those differences.
Expansion May Not Be Repeatable
The business gained $1,100 in expansion MRR during September.
That does not mean the same customers will expand by another $1,100 every month.
Some upgrades represent one-time changes in subscription size.
Others reflect recurring growth in usage or contracted services.
A business should not automatically extrapolate one period's expansion into a sustained growth trajectory.
Forecasting requires assumptions about future customer behavior, not merely repeating the latest observed increase.
The MRR Bridge: Where Growth Actually Came From
A useful way to reconcile recurring revenue is to construct an MRR bridge.
The bridge separates revenue movements into distinct categories.
For the hypothetical company:
| MRR Component | Amount |
|---|---|
| Starting MRR | $3,000 |
| New MRR | +$1,200 |
| Expansion MRR | +$1,100 |
| Contraction MRR | $0 |
| Churned MRR | -$600 |
| Ending MRR | $4,700 |
The calculation reconciles:
$3,000 + $1,200 + $1,100 - $600
= $4,700
The MRR bridge explains the arithmetic behind the company's growth.
It reveals that total recurring revenue increased by $1,700.
Of that increase:
$1,200 came from new customers.
$500 came from net expansion within the starting cohort.
This is more informative than reporting a single growth percentage.
The bridge can also reveal whether growth depends primarily on new acquisition or existing customer expansion.
In a production subscription model, additional movement categories may be needed for reactivations, currency effects, migrations, and other billing adjustments.
Those categories should be defined consistently and reconciled without double counting.
A Practical SQL Example for Retention Analysis
The calculations can be reproduced using SQL.
Consider a hypothetical table:
subscription_mrr_snapshots
with the following fields:
- snapshot_date
- account_id
- mrr_usd
Each snapshot records the normalized monthly recurring revenue associated with a customer account.
The following example uses GoogleSQL syntax for BigQuery.
It compares the customer cohort active on August 31, 2026, with its status on September 30, 2026.
The query first establishes the starting cohort.
It then joins those customers to their ending MRR.
New customers are deliberately excluded from the retention calculation.
WITH starting_cohort AS (
    SELECT
        account_id,
        SUM(mrr_usd) AS starting_mrr
    FROM subscription_mrr_snapshots
    WHERE snapshot_date = DATE '2026-08-31'
    GROUP BY account_id
    HAVING SUM(mrr_usd) > 0
),

ending_accounts AS (
    SELECT
        account_id,
        SUM(mrr_usd) AS ending_mrr
    FROM subscription_mrr_snapshots
    WHERE snapshot_date = DATE '2026-09-30'
    GROUP BY account_id
),

account_movements AS (
    SELECT
        s.account_id,
        s.starting_mrr,
        COALESCE(e.ending_mrr, 0) AS ending_mrr
    FROM starting_cohort s
    LEFT JOIN ending_accounts e
        ON s.account_id = e.account_id
),

retention_components AS (
    SELECT
        COUNT(*) AS starting_customers,

        COUNTIF(ending_mrr > 0)
            AS retained_customers,

        SUM(starting_mrr)
            AS starting_mrr,

        SUM(ending_mrr)
            AS retained_cohort_ending_mrr,

        SUM(
            GREATEST(
                ending_mrr - starting_mrr,
                0
            )
        ) AS expansion_mrr,

        SUM(
            GREATEST(
                starting_mrr - ending_mrr,
                0
            )
        ) AS lost_mrr

    FROM account_movements
)

SELECT
    starting_customers,
    retained_customers,
    starting_mrr,
    retained_cohort_ending_mrr,
    expansion_mrr,
    lost_mrr,

    ROUND(
        100 * SAFE_DIVIDE(
            retained_customers,
            starting_customers
        ),
        1
    ) AS customer_retention_pct,

    ROUND(
        100 * SAFE_DIVIDE(
            starting_mrr - lost_mrr,
            starting_mrr
        ),
        1
    ) AS grr_pct,

    ROUND(
        100 * SAFE_DIVIDE(
            retained_cohort_ending_mrr,
            starting_mrr
        ),
        1
    ) AS nrr_pct

FROM retention_components;
For the hypothetical five-customer dataset, the query produces:
Customer retention: 60.0%
GRR: 80.0%
NRR: 116.7%
This example uses account-level beginning and ending snapshots.
It is suitable for illustrating endpoint-based retention calculations.
A production system requires additional decisions.
For example, if an account cancels and reactivates during the same month, beginning and ending snapshots alone may conceal the intervening movements.
Similarly, if an account upgrades one product while downgrading another, netting changes at the account level may conceal gross expansion and contraction across products.
For detailed movement reporting, a transaction-level subscription movement ledger may be preferable.
The analytical grain must be documented explicitly.
Customer-level retention and subscription-level retention are not always interchangeable.
How to Design a Retention Dashboard
A useful retention dashboard should not present NRR as an isolated performance indicator.
It should connect revenue movement, customer movement, and business decisions.
A practical structure includes four analytical layers.
Layer 1: Executive Summary
Display:
- Starting MRR
- Ending MRR
- Total MRR growth
- NRR
- GRR
- Customer retention
These metrics establish the overall financial and customer retention picture.
Layer 2: Revenue Movement
Display an MRR bridge separating:
- New MRR
- Expansion MRR
- Contraction MRR
- Churned MRR
This helps explain why recurring revenue changed.
Layer 3: Customer Segmentation
Break retention down by decision-relevant segments.
Possible dimensions include:
- Customer size
- Subscription tier
- Acquisition cohort
- Product
- Industry
- Contract type
- Customer tenure
Segment-level analysis can reveal whether favorable company-wide retention is concentrated among a small group of customers.
However, small segments should be interpreted cautiously.
A retention percentage based on five customers is much less stable than one based on several thousand.
Layer 4: Diagnostic Investigation
When retention changes, investigate possible explanations.
Examples include:
- Pricing changes
- Product adoption
- Support experience
- Contract renewals
- Competitive pressure
- Customer concentration
- Subscription migrations
- Billing failures
The dashboard identifies where patterns exist.
It does not automatically establish what caused them.
For a broader approach to selecting business metrics, see the existing UAD article on building a KPI framework.
Why Retention Analysis Should Use Cohorts
Blended company-level metrics can change because the customer population changes.
Suppose a company acquires many new customers in September.
Those customers may have different subscription sizes, product usage, or retention characteristics than customers acquired a year ago.
Comparing blended retention without controlling for cohort composition can be misleading.
A cohort approach groups customers according to a defined starting period and follows those same customers over time.
For example:
January acquisition cohort
February acquisition cohort
March acquisition cohort
Each cohort can be evaluated at comparable maturity.
This helps distinguish changes in customer behavior from changes in the composition of the overall customer base.
A six-month-old cohort should not be compared naively with a one-month-old cohort.
Similarly, monthly NRR and annual NRR describe different measurement horizons.
A monthly retention rate should not automatically be interpreted as an annual retention rate.
The measurement window must be included in the metric definition.
This approach complements UAD Consulting's existing customer acquisition profitability framework, which evaluates cohort contribution and acquisition payback.
Acquisition analysis asks whether customers were worth acquiring.
Retention analysis asks how those customer relationships and their recurring revenue develop after acquisition.
Both are needed for a more complete view of customer economics.
What High NRR Does Not Prove
High net revenue retention is evidence that recurring revenue from a starting cohort increased after accounting for expansion and losses.
It does not prove that:
- Customers are satisfied.
- Product quality improved.
- Customer success interventions worked.
- The business is profitable.
- Expansion will continue.
- Customer acquisition is efficient.
- Churn is economically unimportant.
These are separate questions.
For example, a company may increase prices and observe higher recurring revenue among customers who remain.
That association does not establish that the pricing change improved long-term customer economics.
The price increase may also affect churn, acquisition, service costs, or future customer behavior.
Similarly, customers receiving more customer success attention may exhibit higher retention.
But those customers may have been larger or more engaged before receiving the additional attention.
Observed retention differences do not automatically establish the causal effect of the customer success program.
To estimate incremental business impact, the company may need a controlled experiment or another credible evaluation design.
Descriptive retention analytics is useful for identifying patterns and prioritizing investigation.
Causal analysis is needed when the decision depends on whether an intervention actually changes outcomes.
Which Retention Metric Should Management Prioritize?
The answer depends on the decision.
| Business Question | Primary Metric |
|---|---|
| Are existing customers staying? | Customer retention |
| How much existing revenue are we losing? | GRR |
| Is expansion offsetting revenue losses? | NRR |
| Is total recurring revenue growing? | Total MRR growth |
| Where is growth coming from? | MRR bridge |
| Are a few customers driving results? | Revenue concentration |
| Are newer customers behaving differently? | Cohort retention |
No single metric answers all of these questions.
For a company evaluating customer success performance, customer retention and GRR may be particularly useful.
For a company evaluating expansion within its existing customer base, NRR may be more relevant.
For financial planning, the MRR bridge and revenue concentration may provide important additional context.
The objective is not to declare one metric superior.
It is to select metrics that correspond to the business decision.
Common Retention Measurement Mistakes
Including New Customers in NRR
NRR evaluates the starting customer cohort.
New customers acquired during the period should not inflate the cohort's retention result.
Ignoring Downgrades
A customer may remain active while reducing subscription spending.
Customer retention would count that customer as retained.
GRR and NRR should reflect the contraction.
Mixing Customer and Subscription Counts
One customer may hold multiple subscriptions.
Canceling one subscription does not necessarily mean the customer relationship ended.
The metric should define whether the analytical unit is an account, customer, subscription, or contract.
Mixing Revenue and MRR
MRR is a normalized recurring revenue measure.
It is not necessarily equal to recognized accounting revenue or cash collected during the month.
One-time fees, credits, refunds, annual contracts, and billing timing require explicit treatment.
Ignoring Currency Changes
For international businesses, exchange-rate movements can change reported revenue without equivalent changes in underlying subscriptions.
Constant-currency retention may be useful when comparing operating performance.
Ignoring Reactivations
A returning customer may need separate treatment from a newly acquired customer or a continuously retained customer.
The business should establish a consistent reactivation definition.
Treating Retention as Profitability
An account can generate substantial recurring revenue while requiring expensive support or service delivery.
Revenue retention should therefore be connected to contribution economics when profitability is the management objective.
A Practical Retention Measurement Framework
A reliable retention reporting process should answer six questions.
First, what is the unit of analysis?
Define whether the business measures accounts, customers, contracts, or subscriptions.
Second, what is the starting population?
Identify the customers active at the beginning of the measurement window.
Third, what counts as recurring revenue?
Document exclusions, currency treatment, billing adjustments, and normalization rules.
Fourth, how are revenue movements classified?
Separate new business, expansion, contraction, churn, and reactivation where applicable.
Fifth, which metrics support the decision?
Select customer retention, GRR, NRR, MRR growth, and relevant segmentation according to the business question.
Sixth, how will the calculations be validated?
Reconcile beginning MRR, revenue movements, and ending MRR.
Verify customer identifiers, cohort membership, subscription status, and movement classifications.
This framework turns retention reporting from a collection of percentages into a repeatable analytical process.
Frequently Asked Questions
Can NRR exceed 100% while customer retention declines?
Yes.
NRR can exceed 100% when expansion revenue from existing customers exceeds revenue lost through churn and contraction.
Customer retention may decline at the same time.
The two metrics measure different outcomes.
Is NRR the same as revenue growth?
No.
NRR measures recurring revenue changes within the starting customer cohort.
Total revenue growth can also include newly acquired customers.
Can GRR exceed 100%?
Under the standard gross revenue retention definition, no.
GRR excludes expansion revenue and therefore cannot exceed 100%.
Is customer retention more important than NRR?
Neither is universally more important.
Customer retention measures the continuity of customer relationships.
NRR measures recurring revenue changes within the existing customer base.
The appropriate emphasis depends on the decision.
Does high NRR mean a business is profitable?
No.
NRR measures recurring revenue retention and expansion.
It does not account for all costs required to acquire, support, and serve customers.
Should retention be measured monthly or annually?
Both can be useful.
Monthly reporting provides more frequent operational feedback.
Annual reporting may be more relevant for businesses with annual contracts or long renewal cycles.
The reporting period should be stated explicitly.
The Goal Is Not Just Revenue Growth
Return to the hypothetical company.
It began with five customers and $3,000 in monthly recurring revenue.
By the end of the month, only three of those customers remained.
Customer retention was 60%.
Yet expansion from the remaining customers increased NRR to 116.7%.
After adding new customers, total MRR increased to $4,700.
The business grew.
But that growth did not eliminate the need to understand customer losses.
A more complete evaluation would consider revenue concentration, customer retention, gross revenue retention, expansion, customer economics, and the sustainability of future growth.
The strongest business analytics systems do more than report whether a number increased.
They explain what changed, which components contributed to the result, and what management should investigate next.
Revenue growth is an important outcome.
Understanding the customer relationships behind that growth makes it more useful for decision-making.
References and Further Reading
- Stripe. Net Revenue Retention vs. Gross Revenue Retention: What Each Can Tell Businesses.
- ChartMogul. Two Most Crucial Metrics in SaaS: Net and Gross Retention Rates.
- UAD Consulting. Is Your Customer Acquisition Cost Actually Profitable? A Cohort Framework for Better Growth Decisions. See the contextual link in “Why Retention Analysis Should Use Cohorts.”
- UAD Consulting. How to Build a KPI Framework That Actually Supports Business Decisions. See the contextual link in “How to Design a Retention Dashboard.”
All customer and revenue figures in the worked example are hypothetical.
They are intended to illustrate metric definitions and analytical relationships, not represent actual subscription business performance.
Turn Customer Data Into Better Business Decisions
UAD Consulting helps organizations connect customer behavior, revenue performance, and business analytics to build clearer measurement frameworks and decision-ready reporting.
Whether the challenge involves retention analysis, customer segmentation, recurring revenue, or performance measurement, the objective is to understand the business behind the metrics.
Explore our Business Analytics & Reporting services to discuss how structured analysis can support better business decisions.
Explore ServicesGet in Touch