Insights on analytics, data-driven decision-making, and applied research.
Data Engineering & Database Analytics
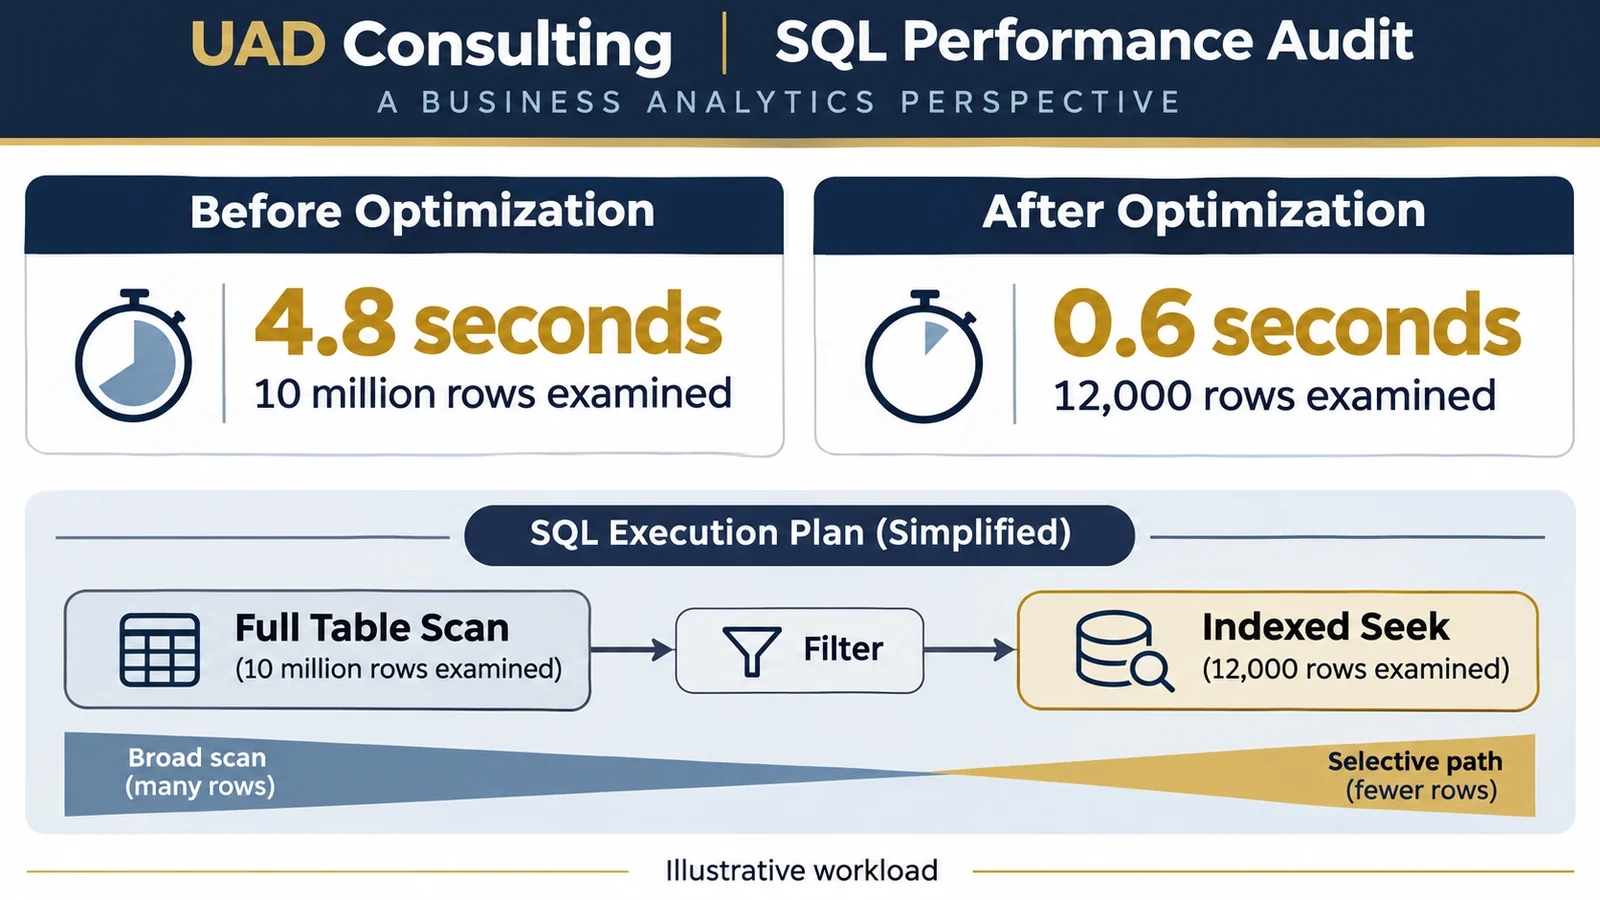
Why Is Your SQL Query So Slow? A Practical Performance Audit Before Buying More Compute
Before paying for more database compute, inspect what your SQL query actually does. A practical audit connects execution plans, indexing, data scans, and cost.
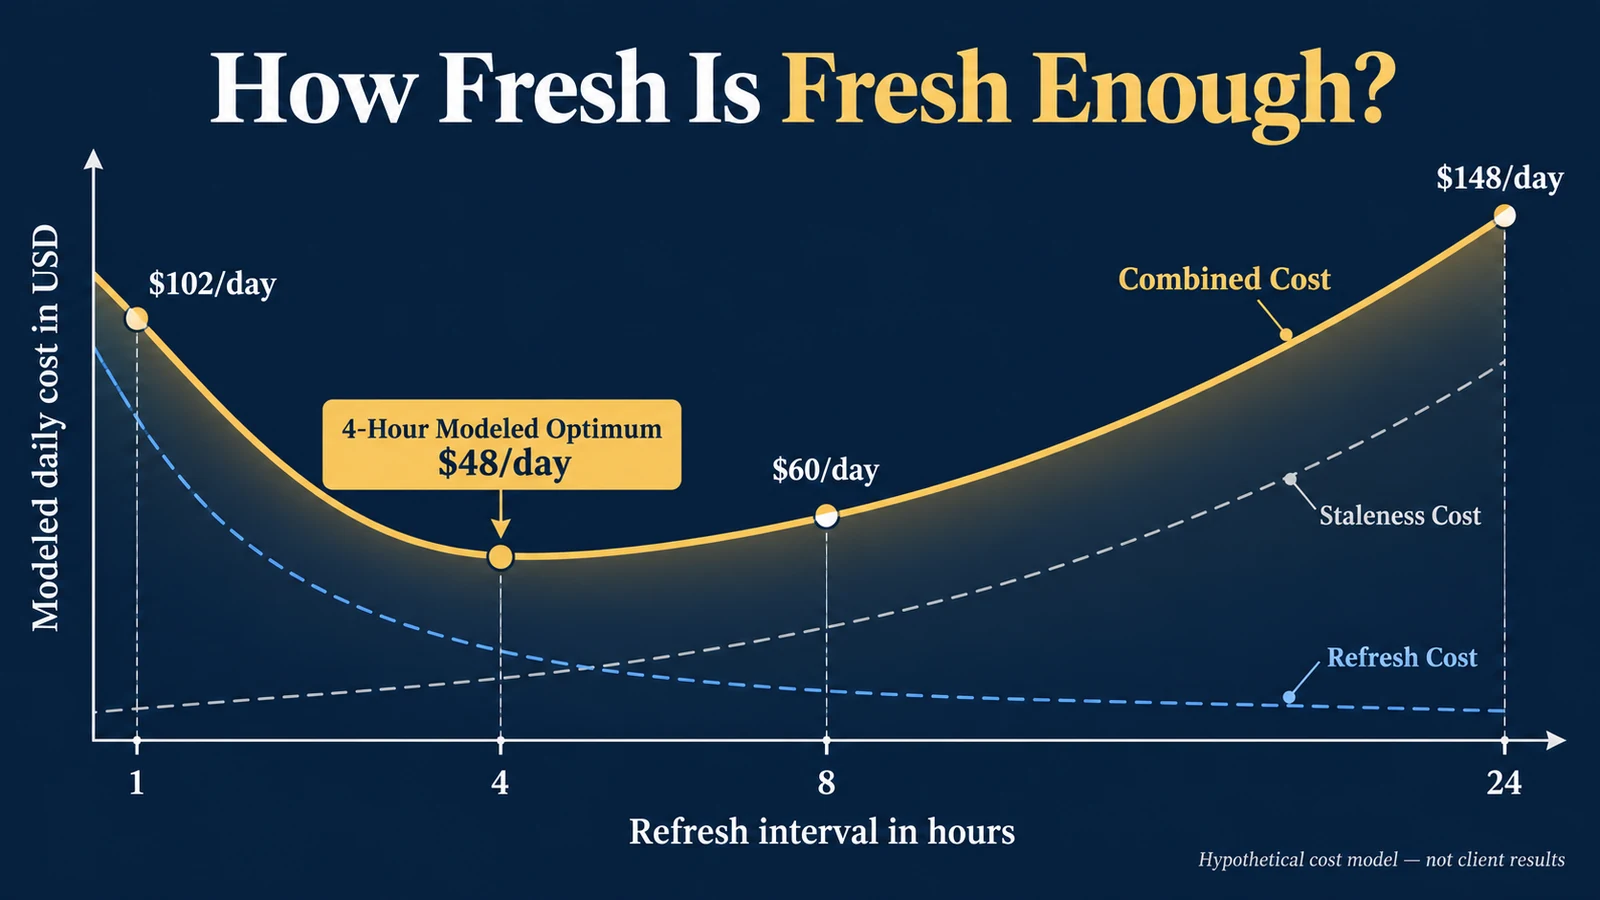
How Often Should You Refresh Your Dashboard? The Business Cost of Stale Data
Should your dashboard refresh every hour, every four hours, or once a day? A worked cost model shows how to balance freshness, infrastructure expense, and decision risk.
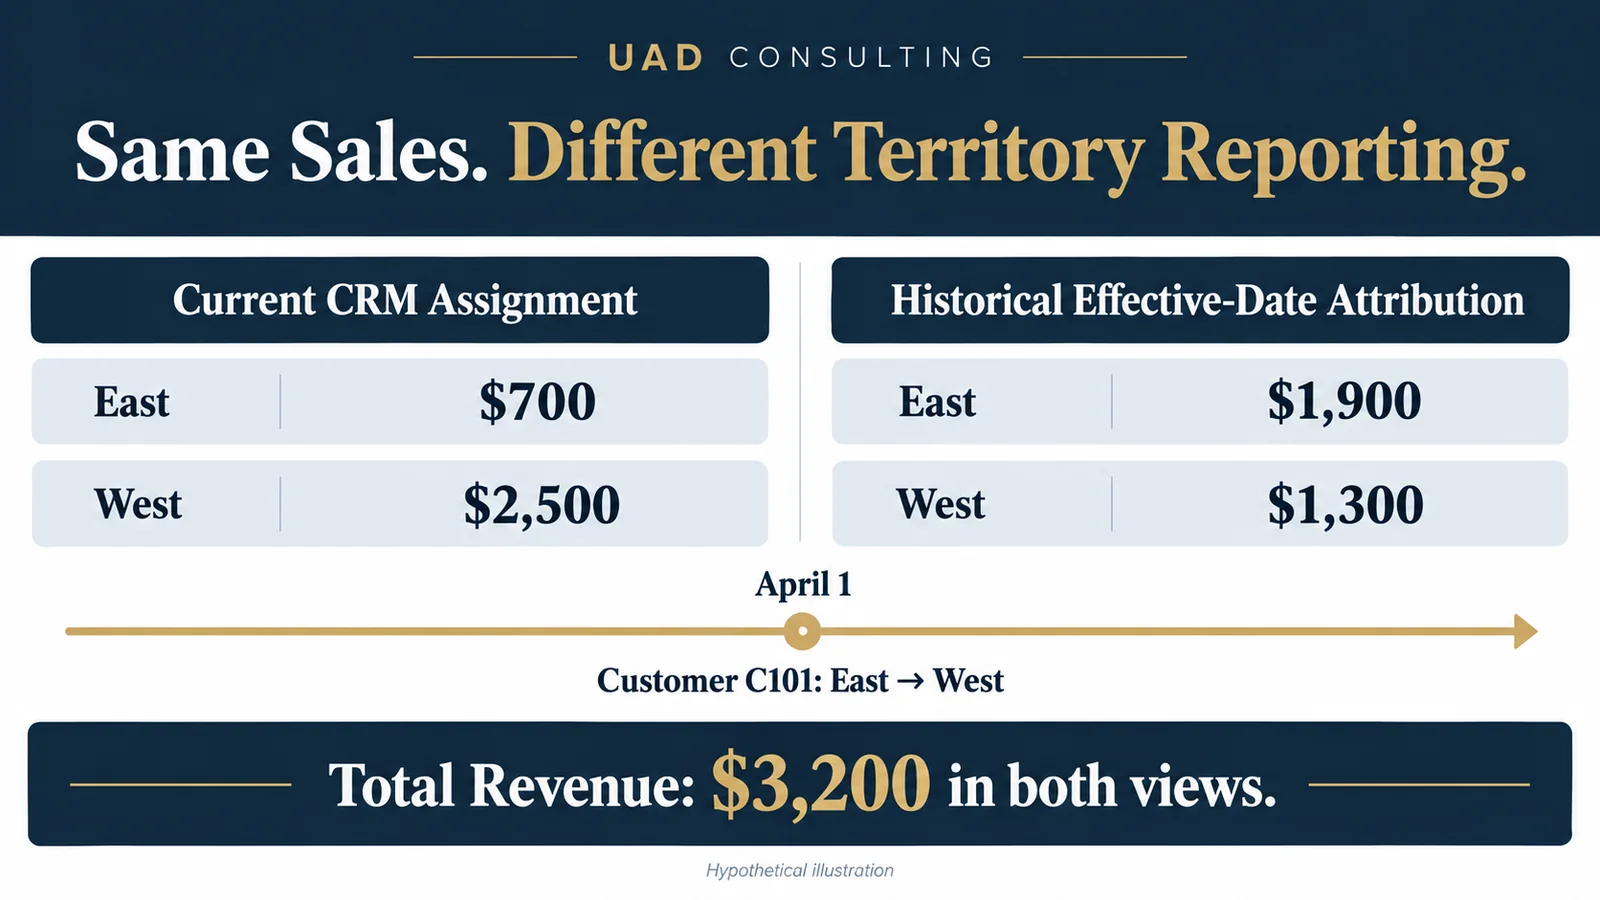
Your Sales Territory Changed. Why Did Last Quarter's Revenue Move?
A CRM reassignment moves $1,200 between sales territories without changing a single order. Learn how SCD Type 2 and temporal SQL joins preserve historical reporting.
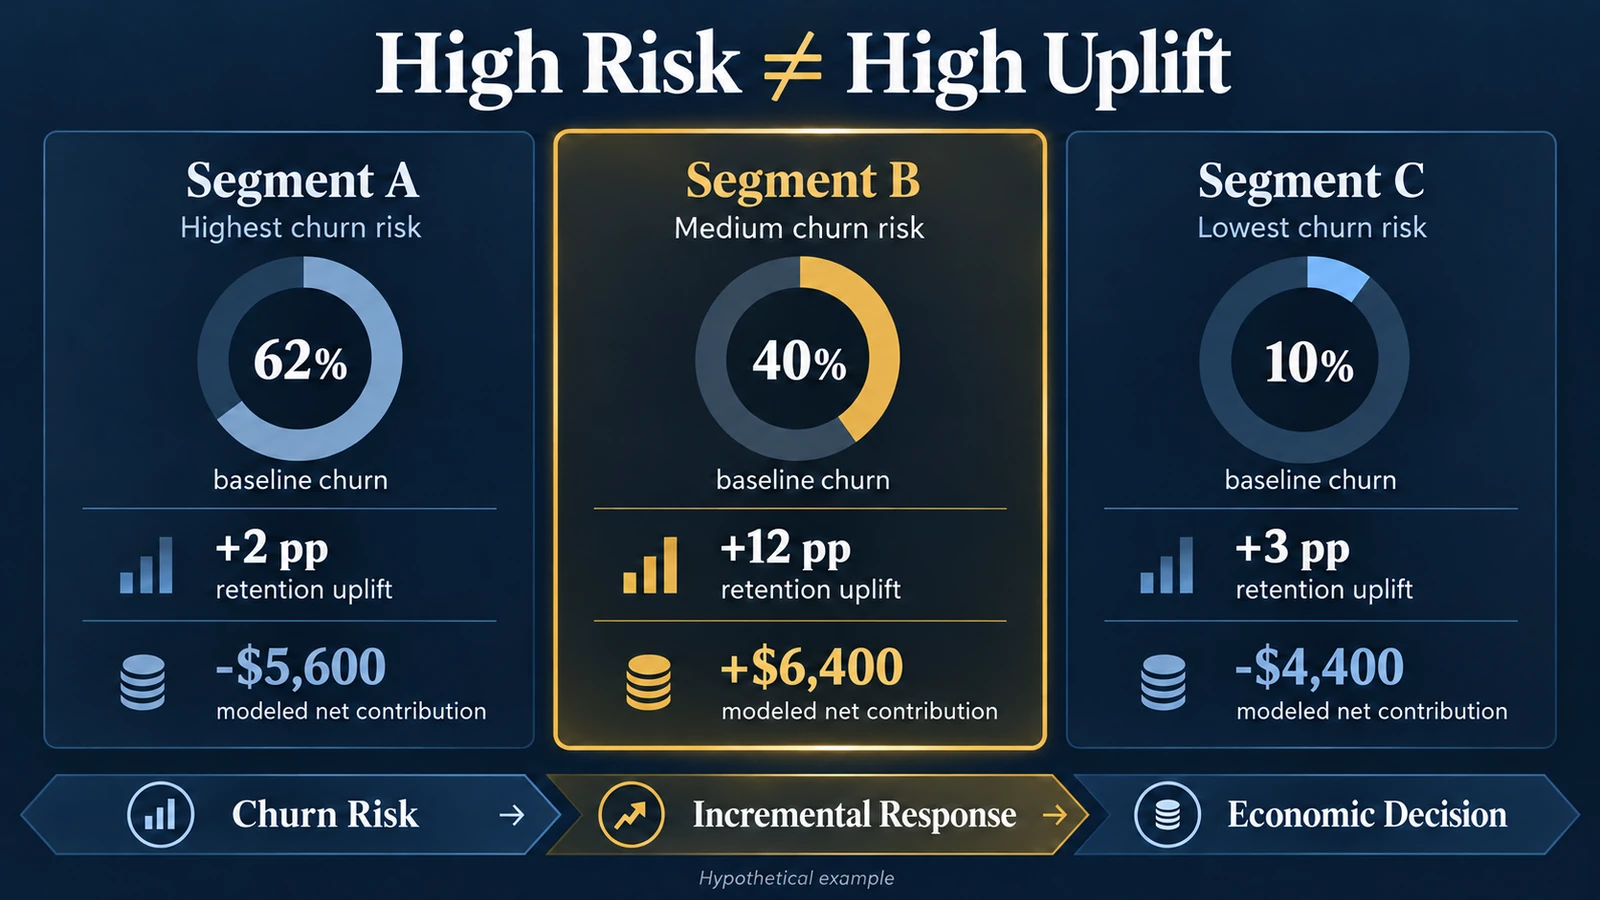
Your Churn Model Identifies High-Risk Customers. But Who Would Actually Respond to a Retention Offer?
A churn model identifies customers likely to leave, but those customers may not respond to a discount. Learn how uplift modeling, randomized holdouts, and contribution margin improve retention targeting.
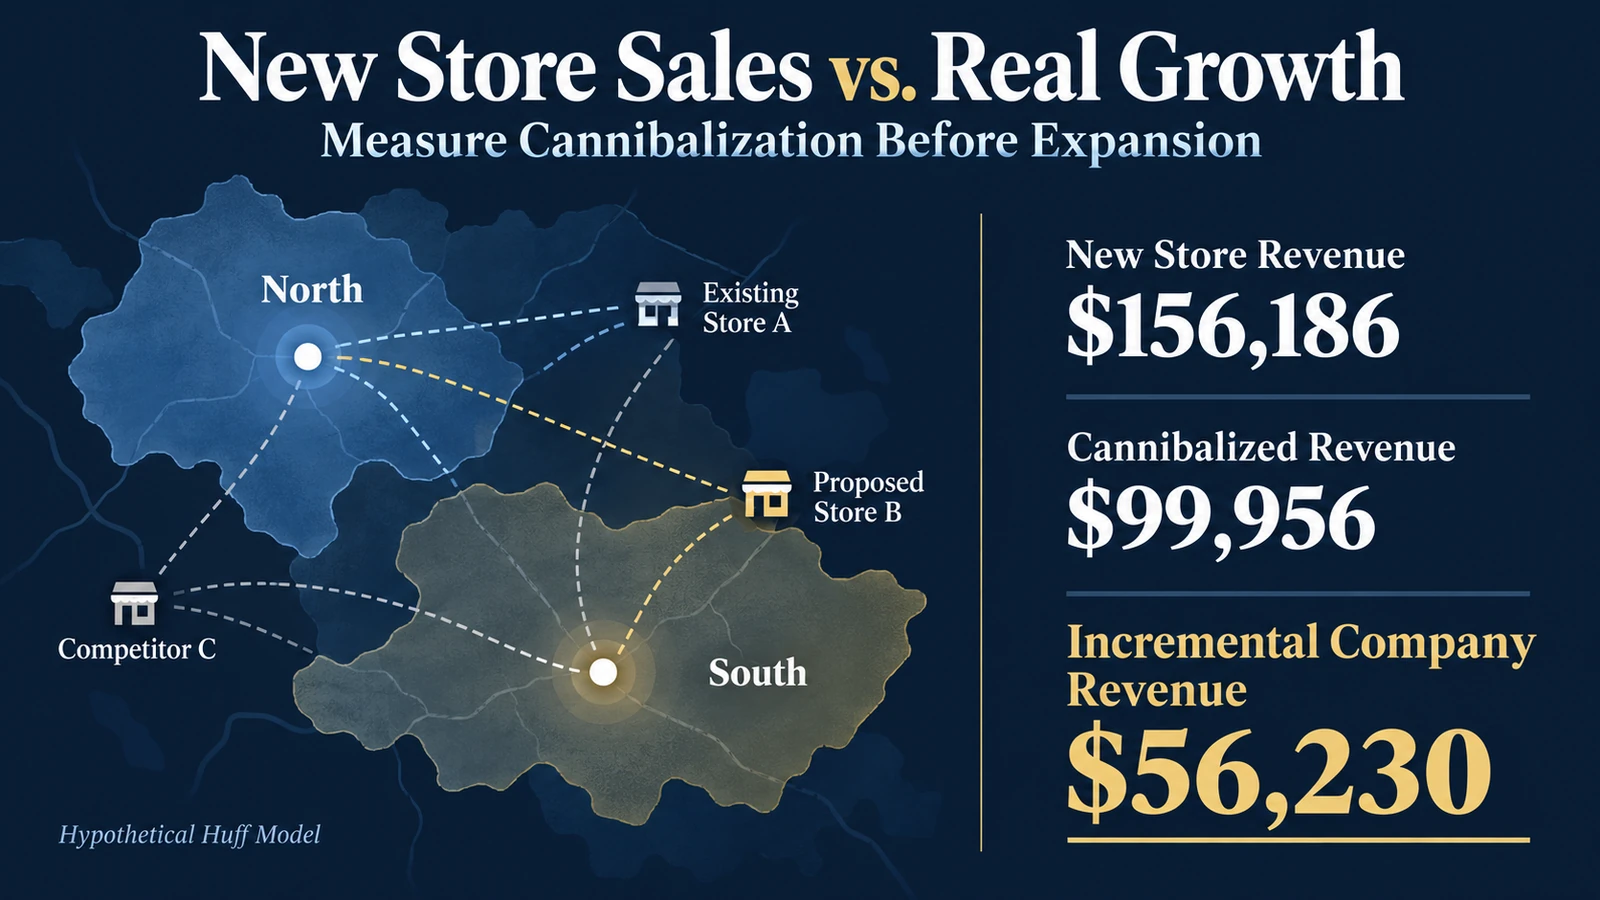
Should You Open a Second Location? Why Projected Sales Can Mislead
A proposed store may generate substantial sales while taking customers from an existing location. Learn how a Huff model separates gross site revenue, cannibalization, and incremental business growth.
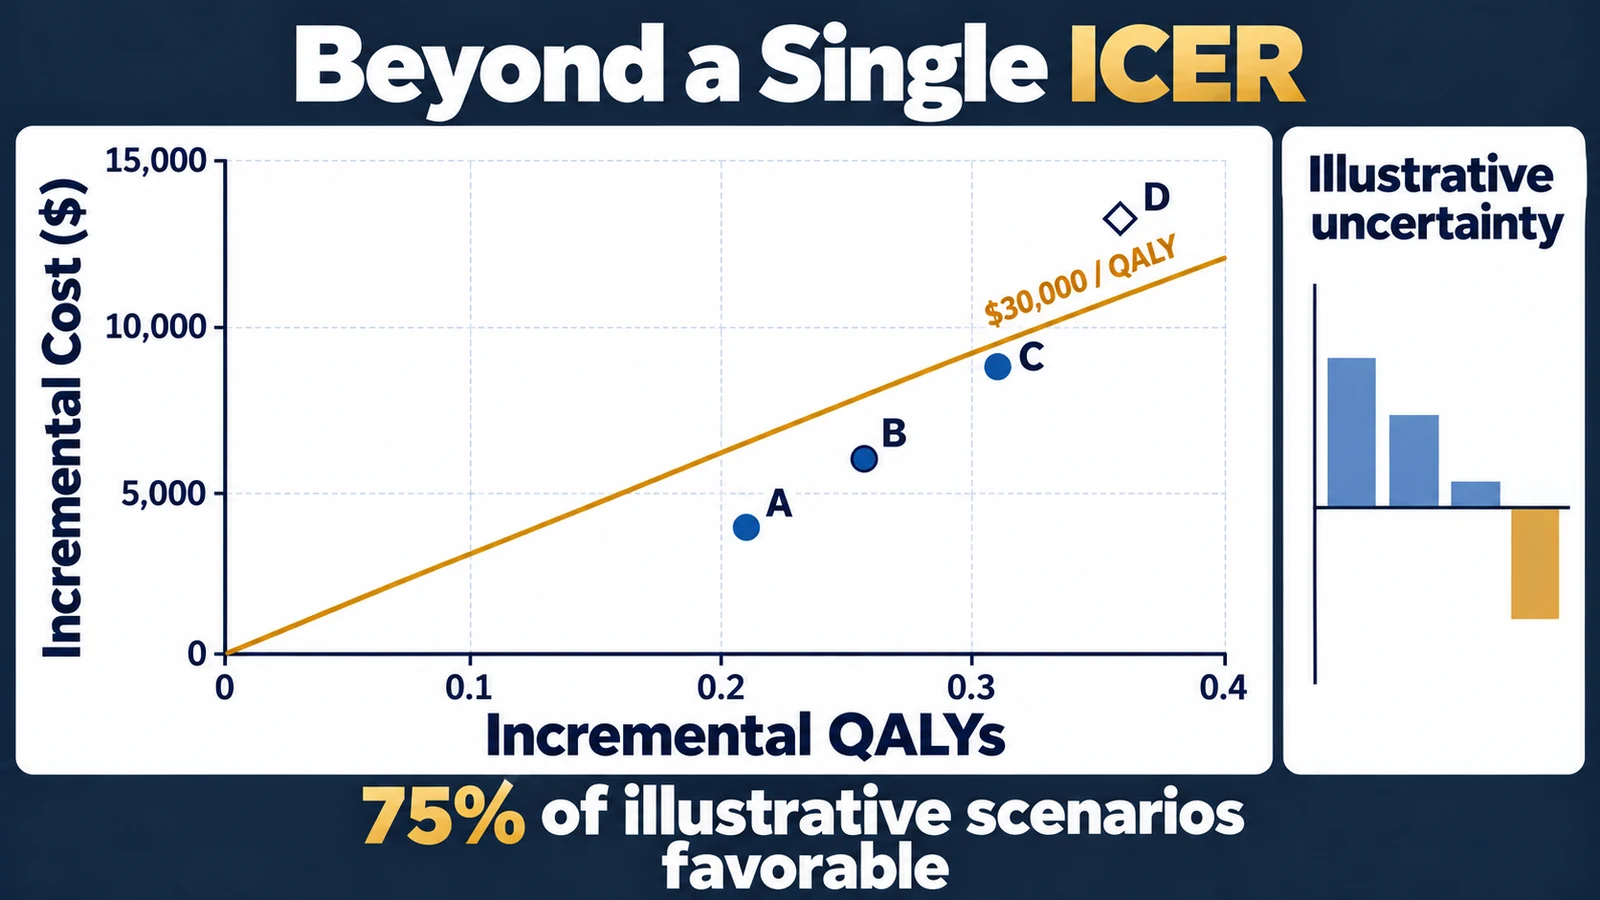
Your Cost-Effectiveness Model Has One ICER. How Certain Is the Decision?
A healthcare model reports an attractive ICER, but uncertain costs and outcomes could change the decision. Learn how probabilistic sensitivity analysis and net monetary benefit reveal the trade-offs.
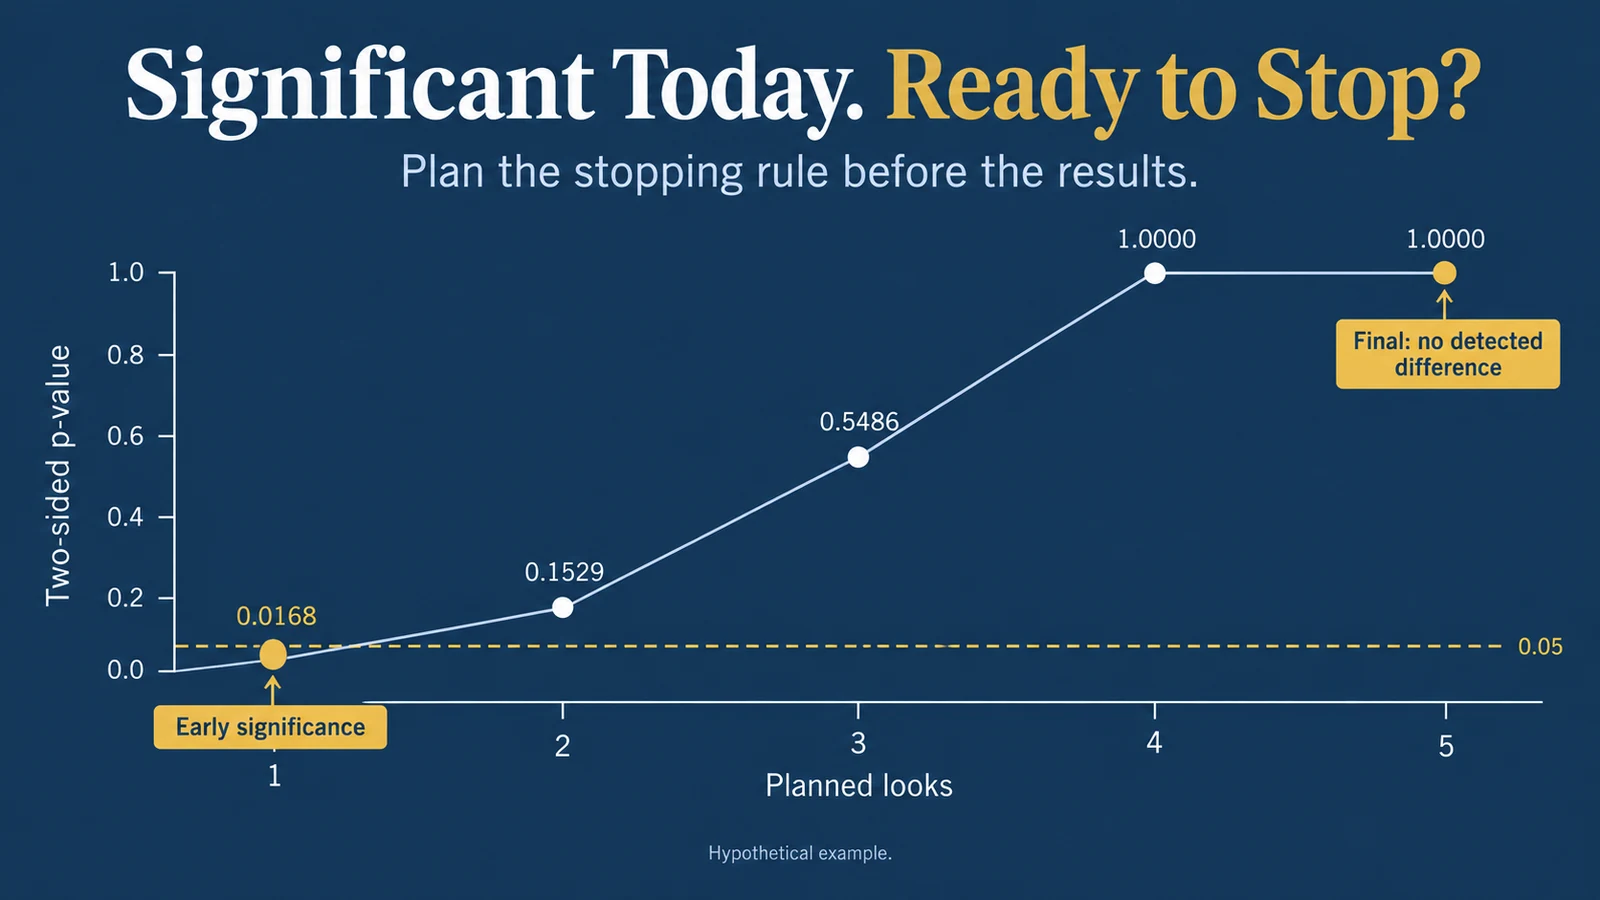
Your A/B Test Became Significant Today. Should You Stop It?
An A/B test becomes significant at an early look, then the apparent advantage disappears. Learn why stopping rules matter with a reproducible 50,000-experiment simulation.
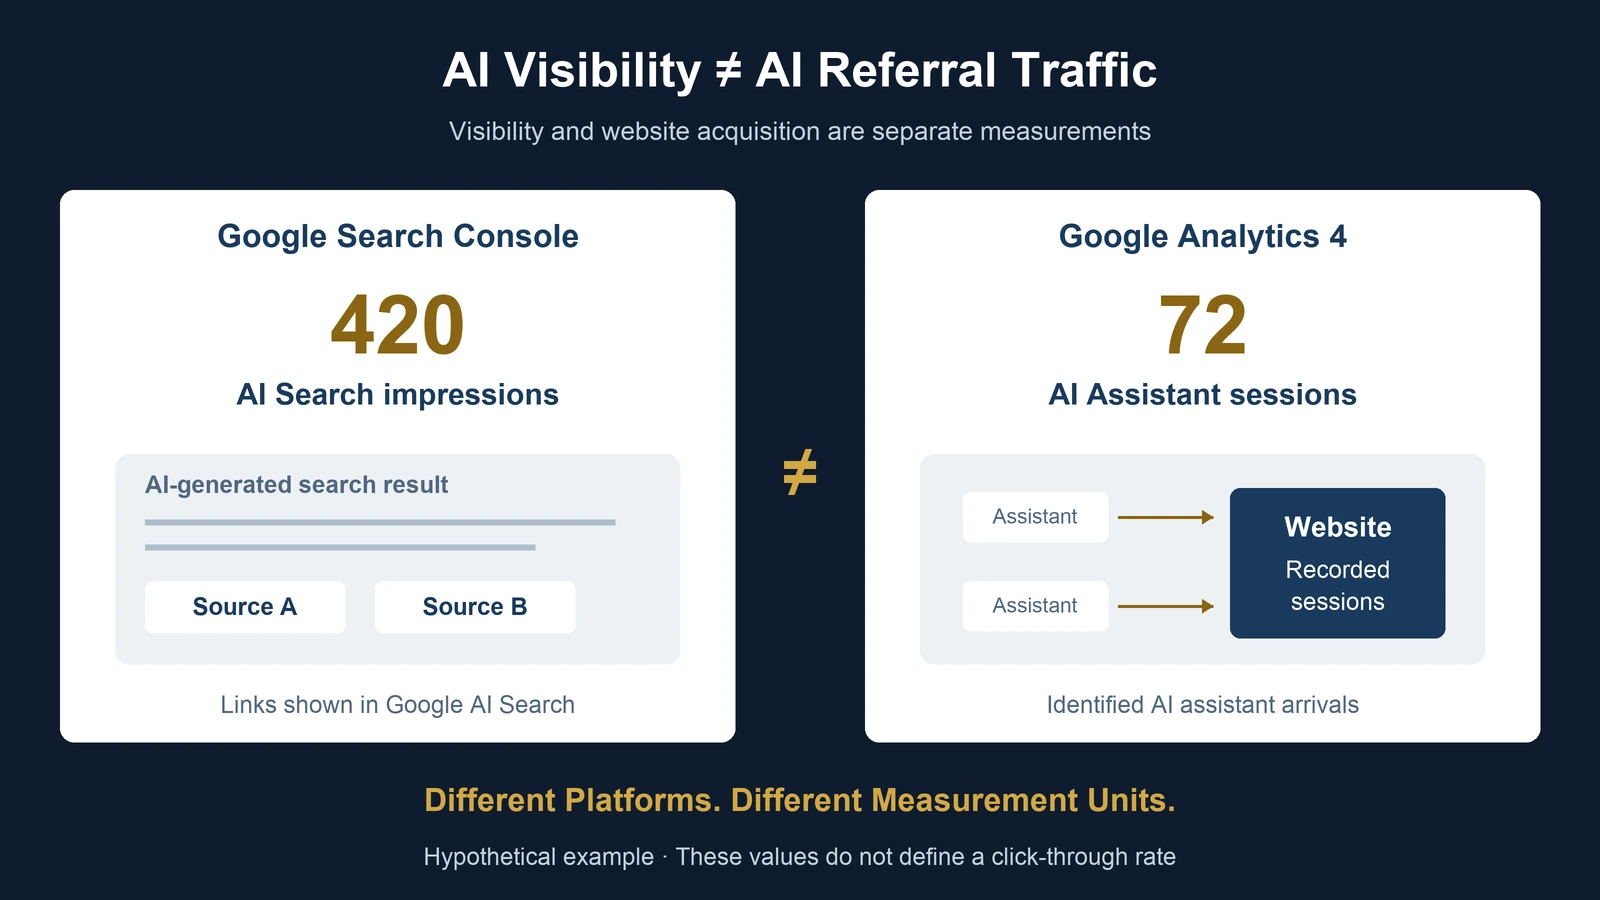
Why Don't Google Search Console AI Impressions Match GA4 AI Assistant Traffic?
Google reports 420 AI Search impressions while GA4 shows 72 AI Assistant sessions. Learn why these numbers measure different things and how to build a trustworthy AI search dashboard.
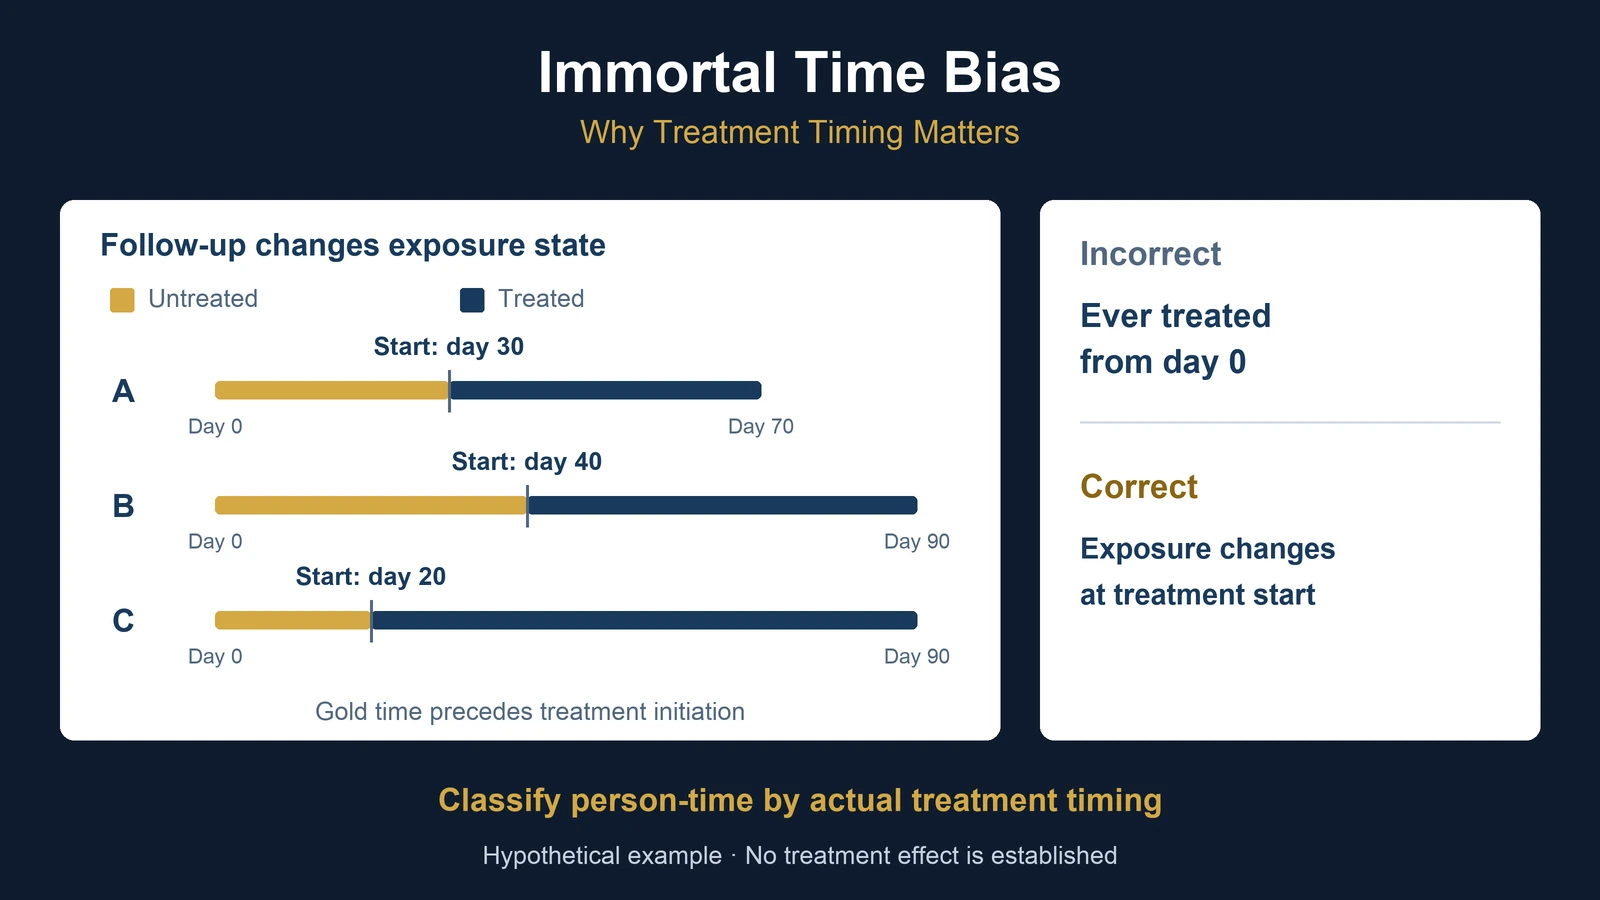
Why Does a Treatment Look More Effective Than It Is?
A healthcare intervention appears to reduce mortality, but the comparison may be biased before the analysis even begins. Learn how immortal time bias arises, how person-time should be classified, and why observational associations require careful interpretation.
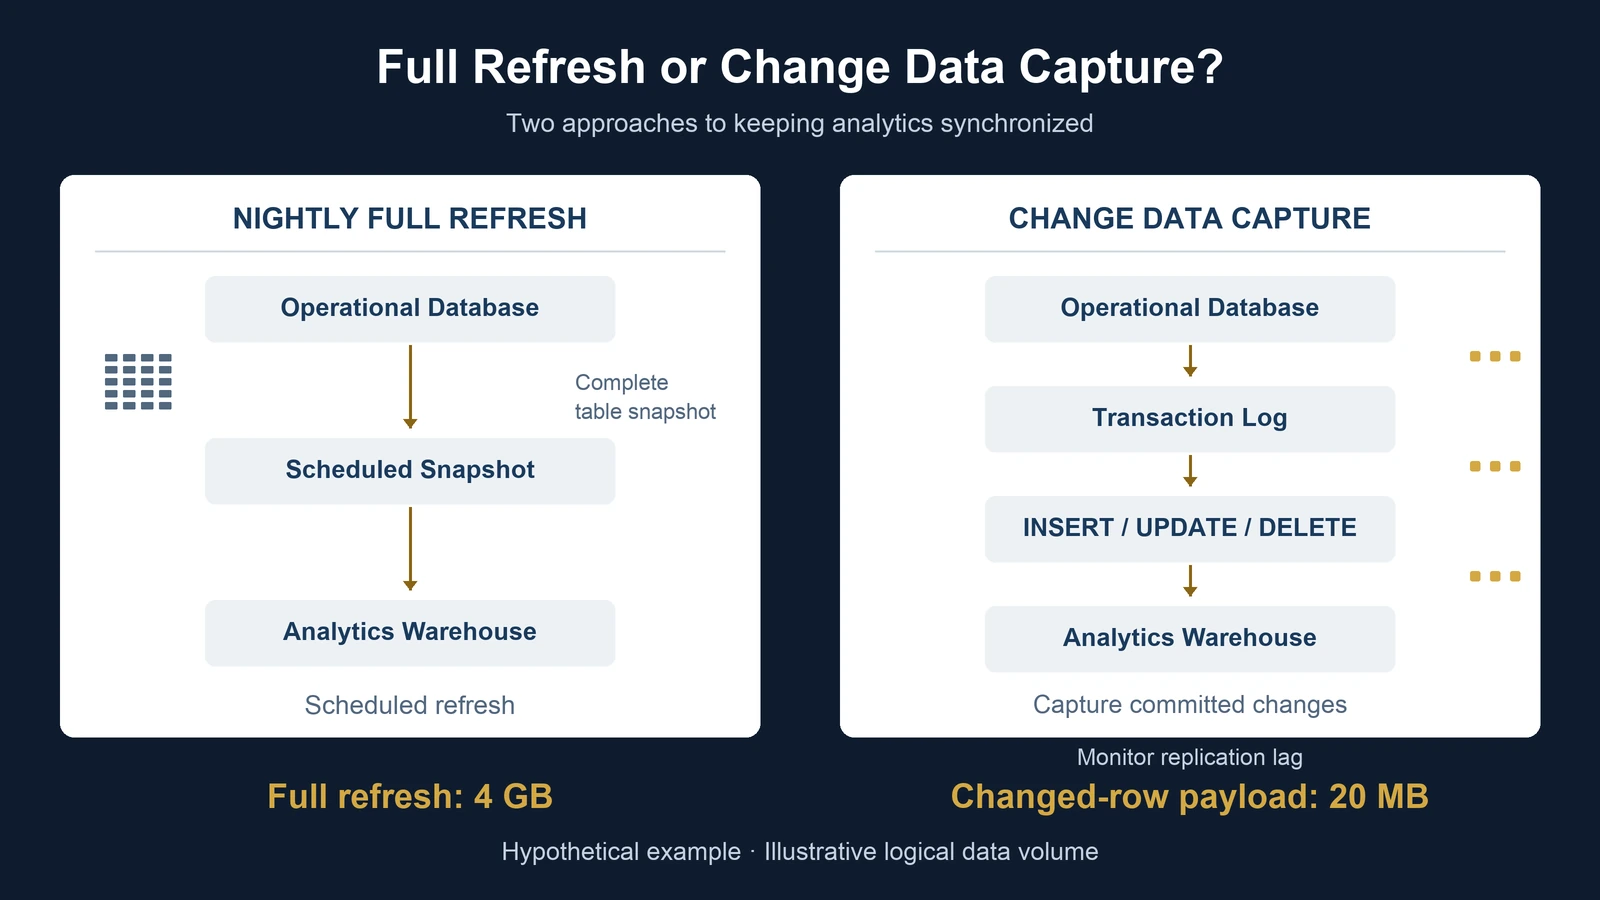
Do You Need Change Data Capture, or Is a Nightly Data Refresh Enough?
Should your analytics database refresh nightly or capture changes throughout the day? Compare full refresh, incremental loading, and CDC using a practical 8-million-row example.
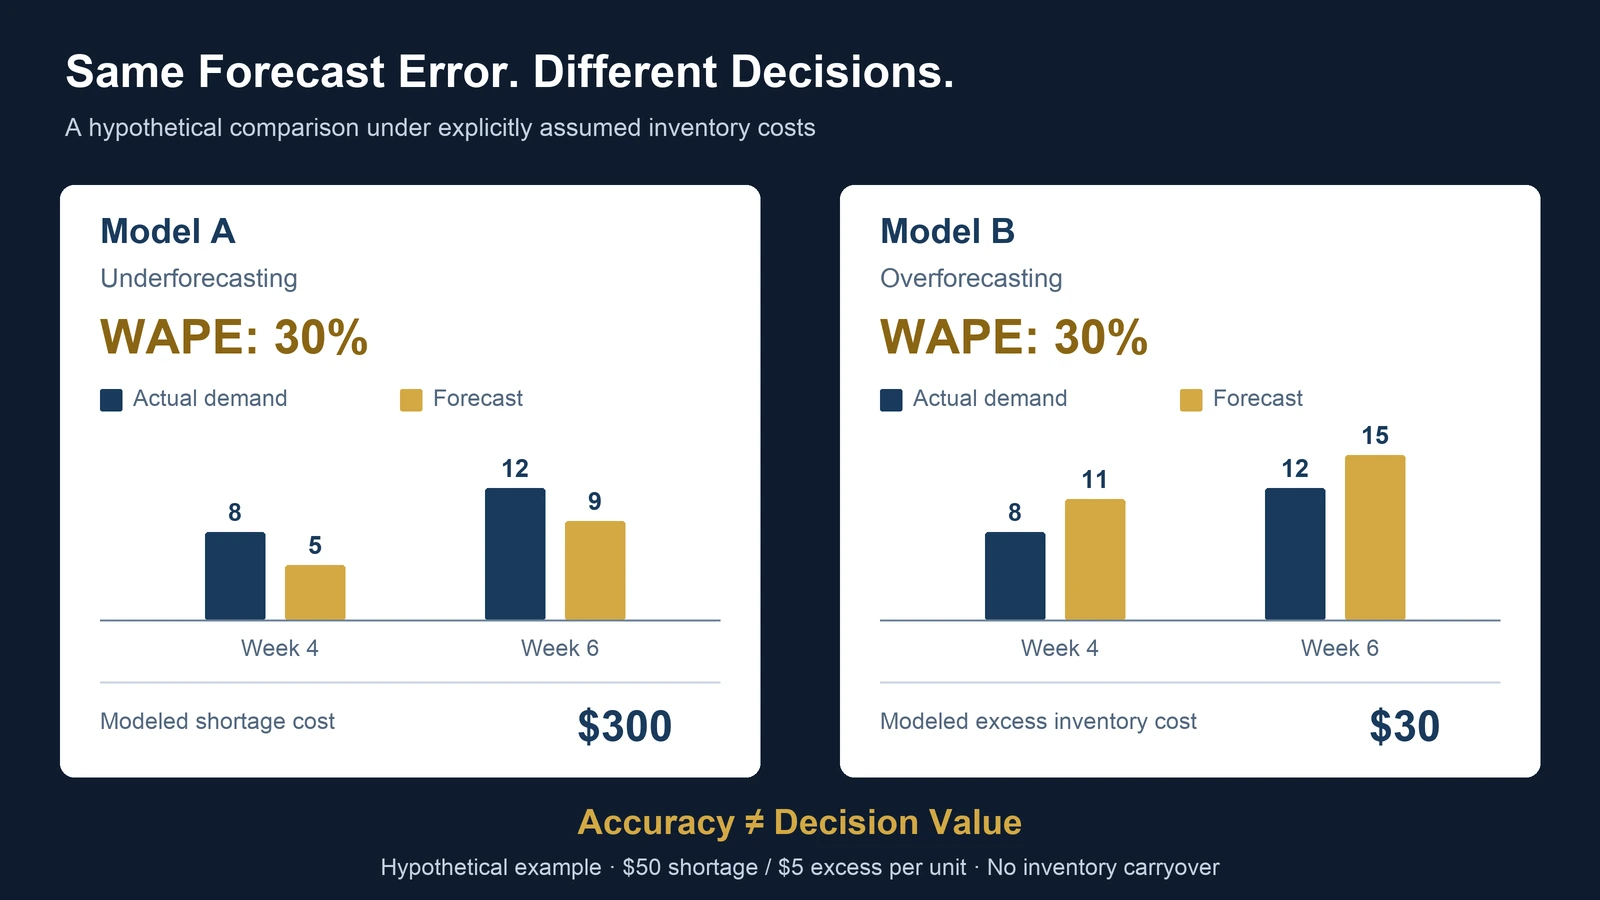
Which Forecast Accuracy Metric Should You Trust for Inventory Decisions?
Two forecasts have identical 30% WAPE, but one creates $300 in shortage costs while the other creates $30 in excess inventory costs. Learn why accuracy alone cannot determine the best inventory decision.