A healthcare organization is evaluating a new intervention.
The economic model reports an incremental cost-effectiveness ratio of approximately $28,000 per quality-adjusted life year gained.
Management considers a hypothetical willingness-to-pay threshold of $30,000 per QALY.
The intervention appears cost-effective.
But a decision-maker asks a more difficult question:
"How confident should we be in that result?"
The model's costs are estimated from imperfect data. Treatment effectiveness may vary. Health utility values have uncertainty. Long-term outcomes may require extrapolation beyond the available evidence.
A single incremental cost-effectiveness ratio cannot communicate all of these uncertainties.
It summarizes one comparison of incremental expected costs and health outcomes.
Probabilistic sensitivity analysis, commonly called PSA, provides a way to propagate uncertainty in model parameters through the economic evaluation.
Rather than relying only on one set of input values, the analyst evaluates how the results change across plausible parameter combinations.
The objective is not to eliminate uncertainty.
It is to understand how uncertainty affects the decision.
The Short Answer: An ICER Is Not a Measure of Decision Certainty
An incremental cost-effectiveness ratio, or ICER, is calculated as:
In cost-utility analysis, effectiveness is commonly measured in quality-adjusted life years, or QALYs.
Suppose a new intervention costs an additional $8,000 per patient and generates an additional 0.285 QALYs.
The ICER is:
This tells us the estimated additional cost per additional QALY.
It does not tell us:
- How uncertain the cost estimate is.
- How uncertain the health benefit is.
- Whether costs and outcomes are correlated.
- How frequently plausible parameter combinations favor the intervention.
- Which assumptions could reverse the preferred decision.
- Whether additional research would be valuable.
A favorable ICER is therefore a starting point for decision analysis, not the complete answer.
Why Uncertainty Matters in Healthcare Economic Models
Healthcare economic evaluations combine multiple sources of evidence.
These may include clinical trials, observational studies, administrative healthcare data, published utility estimates, resource-use information, and expert assumptions.
Each source has limitations.
For example, a model may estimate:
- Treatment effectiveness.
- Hospitalization probability.
- Disease progression.
- Adverse-event rates.
- Healthcare resource utilization.
- Unit costs.
- Health-related quality of life.
- Long-term survival.
Some inputs may be precisely estimated.
Others may be based on small samples or substantial extrapolation.
Even when the model is implemented correctly, its output remains conditional on the available evidence and assumptions.
The ISPOR-SMDM Modeling Good Research Practices Task Force distinguishes parameter uncertainty from individual-level stochastic variation, population heterogeneity, and structural uncertainty.
These distinctions matter because different uncertainties require different analytical responses.
Official reference:
A Worked Example: Four Possible Economic Outcomes
Consider a hypothetical healthcare intervention compared with existing care.
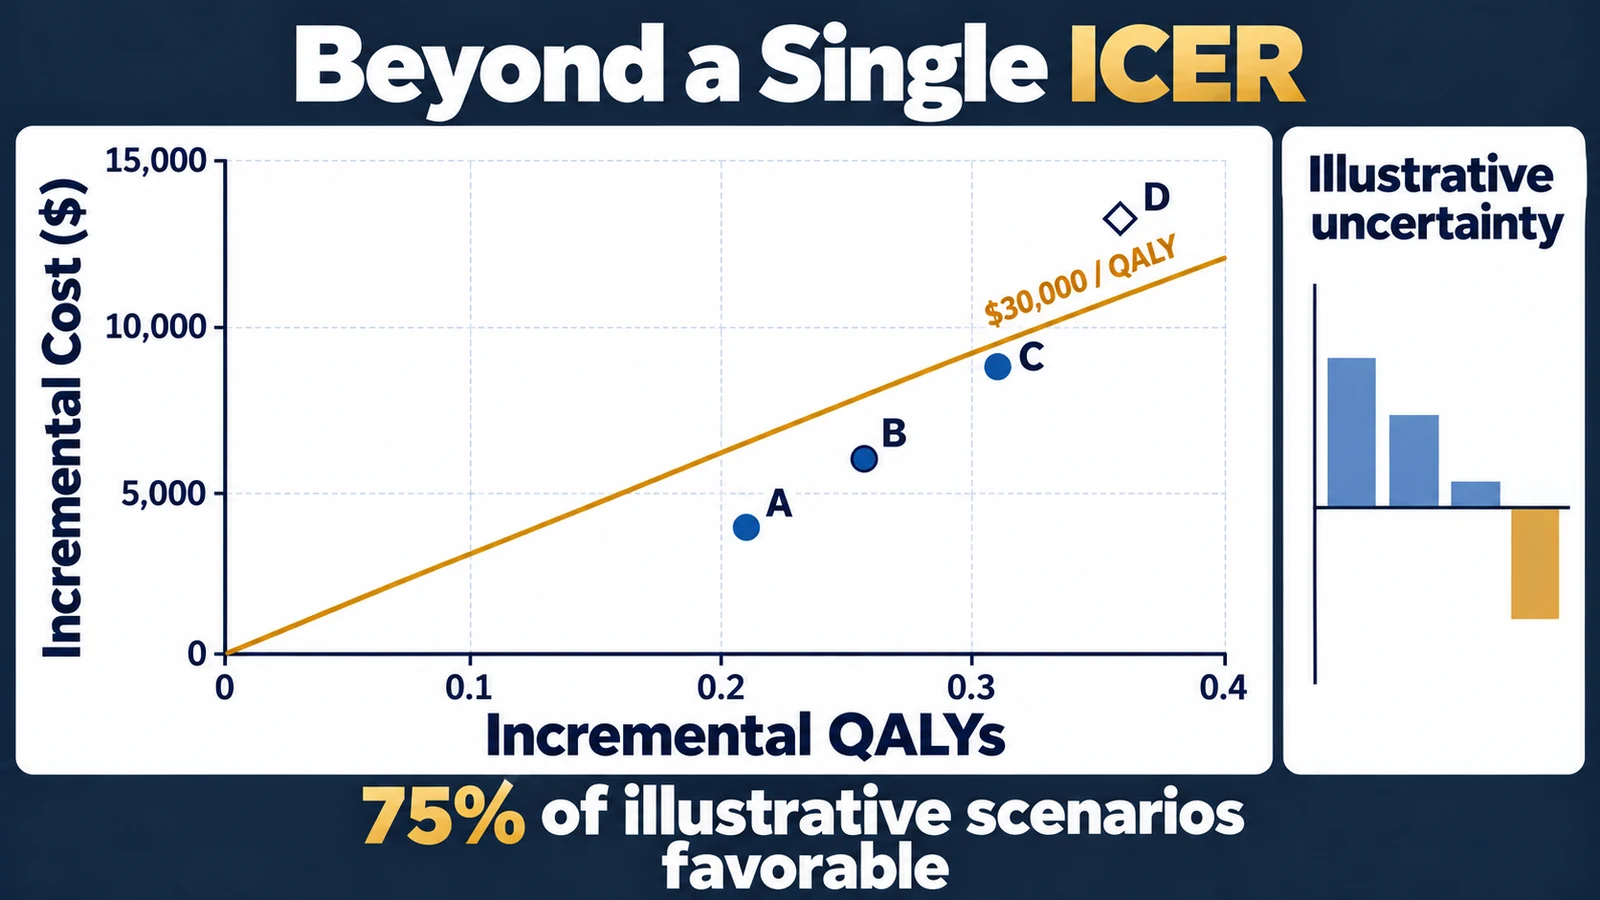
Assume an economic model produces four equally weighted plausible combinations of incremental costs and QALYs.
These are deliberately simplified scenarios for teaching.
They are not actual clinical findings or a statistically validated probabilistic sensitivity analysis.
| Scenario | Incremental Cost | Incremental QALYs | Weight |
|---|---|---|---|
| A | $4,000 | 0.21 | 25% |
| B | $6,000 | 0.26 | 25% |
| C | $9,000 | 0.31 | 25% |
| D | $13,000 | 0.36 | 25% |
All four scenarios assume the intervention produces additional QALYs at additional cost.
However, the incremental costs and benefits differ.
The weights are illustrative assumptions, not probabilities estimated from clinical evidence.
Step 1: Calculate Expected Incremental Cost
Because each scenario has equal weight:
Step 2: Calculate Expected Incremental QALYs
Step 3: Calculate the ICER
Rounded:
$28,070 per QALY gained.
At a hypothetical willingness-to-pay threshold of $30,000 per QALY, the expected ICER is below the threshold.
But does every scenario favor adoption?
No.
That becomes clearer when we calculate net monetary benefit.
Why Incremental Net Monetary Benefit Is Useful
Incremental Net Monetary Benefit, or INMB, converts incremental health benefits into monetary units using a specified willingness-to-pay threshold.
The formula is:
Let the threshold be represented by lambda.
Then:
If INMB is positive, the intervention has higher net monetary benefit than the comparator under the specified assumptions.
If INMB is negative, the comparator has higher net monetary benefit.
A zero value represents a tie.
Unlike an ICER, incremental net monetary benefit remains interpretable when incremental effects are zero or negative.
It is also convenient for comparing expected outcomes across uncertain parameter combinations.
Calculate INMB for Each Scenario
Assume:
Scenario A:
Scenario B:
Scenario C:
Scenario D:
The results are:
| Scenario | Incremental Net Monetary Benefit | Preferred Option |
|---|---|---|
| A | $2,300 | New intervention |
| B | $1,800 | New intervention |
| C | $300 | New intervention |
| D | -$2,200 | Existing care |
Three scenarios favor the intervention.
One favors existing care.
The expected incremental net monetary benefit is:
The expected INMB is positive.
Under this simplified decision model, the intervention is the option with higher expected net monetary benefit.
But the result is not favorable under every possible scenario.
That is the distinction between expected value and decision uncertainty.
What Is a Cost-Effectiveness Acceptability Curve?
A cost-effectiveness acceptability curve, or CEAC, describes the proportion of probabilistic model draws in which an intervention is cost-effective across different willingness-to-pay thresholds.
In a properly specified PSA, this proportion is interpreted conditional on the modeled parameter uncertainty distributions.
It is not an unconditional probability that a treatment works clinically.
It is also not the probability that a particular patient benefits.
A CEAC describes uncertainty about the economic decision under the model.
Calculate the Results at Three Thresholds
Using the same four equally weighted scenarios, calculate INMB at:
$20,000 per QALY.
$30,000 per QALY.
$40,000 per QALY.
The results are:
| Scenario | $20,000 | $30,000 | $40,000 |
|---|---|---|---|
| A | $200 | $2,300 | $4,400 |
| B | -$800 | $1,800 | $4,400 |
| C | -$2,800 | $300 | $3,400 |
| D | -$5,800 | -$2,200 | $1,400 |
At $20,000 per QALY:
One of four scenarios has positive INMB.
Illustrative favorable proportion:
25%.
At $30,000 per QALY:
Three of four scenarios have positive INMB.
Illustrative favorable proportion:
75%.
At $40,000 per QALY:
All four scenarios have positive INMB.
Illustrative favorable proportion:
100%.
The resulting illustrative acceptability points are:
| Willingness-to-Pay Threshold | Favorable Scenario Proportion |
|---|---|
| $20,000 per QALY | 25% |
| $30,000 per QALY | 75% |
| $40,000 per QALY | 100% |
These are not empirical probabilities from a fitted PSA.
They are proportions from a four-point illustrative uncertainty distribution.
A real CEAC would normally be calculated from a sufficiently large set of defensible probabilistic parameter draws.
What the Curve Tells Decision-Makers
The CEAC illustrates how the decision's apparent robustness changes with the willingness-to-pay threshold.
At lower thresholds, additional health benefits may not justify additional costs in many model draws.
At higher thresholds, more combinations of costs and effects become economically favorable.
However, the CEAC does not show how large the financial or health consequences of choosing incorrectly might be.
Two interventions could have similar acceptability probabilities but very different potential losses when the less favorable option is chosen.
This is one reason to examine expected net benefit and value of information alongside the CEAC.
NICE discusses cost-effectiveness acceptability curves and other representations of parameter uncertainty in its economic evaluation methods guidance.
Official reference:
https://www.nice.org.uk/process/pmg36/chapter/economic-evaluation-2/
Why the Probability of Being Cost-Effective Is Not the Whole Decision
Return to the hypothetical $30,000 threshold.
The new intervention is favorable in 75% of scenarios.
Its expected incremental net monetary benefit is positive:
$550 per patient.
These are two different statements.
The first describes the fraction of modeled scenarios favoring the intervention.
The second describes the average net monetary benefit across scenarios.
The preferred option under an expected net-benefit decision rule is the one with the higher expected net benefit.
It is not necessarily the option with the highest probability of being optimal.
For example, a strategy could be favorable in many scenarios but produce very large losses in a small number of scenarios.
Its expected net benefit could then be lower than that of an alternative.
Decision-makers should therefore avoid interpreting the CEAC as a simple adoption recommendation.
Expected consequences, uncertainty, risk, equity, feasibility, and the decision context all matter.
What Is the Expected Value of Perfect Information?
Suppose a healthcare organization could know with certainty which of the four economic scenarios would apply before choosing the intervention.
That information could allow it to select the better option in each scenario.
Expected Value of Perfect Information, or EVPI, measures the maximum expected improvement in decision value from perfectly resolving the modeled uncertainty.
For a two-option comparison where the comparator's incremental net benefit is defined as zero:
Calculate EVPI in the Four-Scenario Example
At $30,000 per QALY, incremental net monetary benefits are:
Scenario A: $2,300.
Scenario B: $1,800.
Scenario C: $300.
Scenario D: -$2,200.
With perfect information, the decision-maker would choose the new intervention in A, B, and C.
In D, the decision-maker would retain existing care.
The best incremental net benefit in each scenario is therefore:
$2,300.
$1,800.
$300.
$0.
Expected value with perfect information:
With current information, the preferred decision is to adopt the intervention because expected INMB is positive.
Expected value with current information:
$550 per patient.
Therefore:
Under this simplified uncertainty model, perfectly resolving the uncertainty would improve expected decision value by at most $550 per patient.
This is not a predicted saving from conducting a study.
It is a theoretical upper bound on the expected value of eliminating the specified uncertainty before making the decision.
Why EVPI Is Useful
Suppose the decision applies to 1,000 eligible patients.
Ignoring discounting, changes over time, and other implementation considerations, the illustrative population EVPI would be:
This provides an upper bound for the expected value of perfect information for that population under the model.
A real study cannot generally eliminate every source of uncertainty.
Its expected value of sample information would normally be lower than or equal to the corresponding EVPI.
Research costs, delays, population size, and the consequences of postponing adoption must also be considered.
The relevant question is not simply whether additional evidence would be interesting.
It is whether obtaining that evidence could improve the decision enough to justify its cost.
What Does a Real Probabilistic Sensitivity Analysis Require?
The four-scenario example is a transparent teaching exercise.
A full probabilistic sensitivity analysis is more demanding.
It typically begins with a validated economic model.
The analyst then identifies uncertain parameters and represents uncertainty using appropriate probability distributions or joint distributions.
For example:
| Parameter | Possible Distributional Approach | Important Consideration |
|---|---|---|
| Probability | Beta | Values constrained between 0 and 1 |
| Positive cost | Gamma or lognormal | Positive values and right-skewness |
| Relative treatment effect | Distribution on a suitable transformed scale | Preserve statistical properties |
| Health utility | Context-appropriate bounded distribution | Respect valid range and evidence |
| Correlated parameters | Joint or multivariate distribution | Preserve supported dependencies |
These are possible approaches, not automatic distribution assignments.
Distribution choices should reflect the available evidence and model structure.
For each PSA iteration, the analyst:
- Draws a plausible set of uncertain parameters.
- Runs the economic model using those parameters.
- Calculates costs and health outcomes for each comparator.
- Calculates incremental costs and effects.
- Calculates incremental net monetary benefit.
- Stores the results.
After many iterations, the analyst examines the distribution of model outcomes.
The outputs may include:
- Expected costs.
- Expected QALYs.
- Incremental costs and QALYs.
- Expected incremental net monetary benefit.
- Cost-effectiveness plane.
- Cost-effectiveness acceptability curve.
- Expected value of perfect information.
- Uncertainty around important decision drivers.
The number of iterations should be sufficient to control Monte Carlo error in the quantities used for decision-making.
More iterations alone do not make unsupported parameter distributions valid.
Why Parameter Correlation Matters
Suppose an intervention is more expensive for patients with more severe disease.
Those same patients may also experience different treatment benefits.
Costs and outcomes may therefore be correlated.
If an analyst independently samples costs and effectiveness while ignoring a supported relationship, the resulting joint distribution may be unrealistic.
Some simulated combinations could be implausible.
The uncertainty analysis may then overstate or understate decision uncertainty.
A credible PSA should preserve important dependencies when evidence supports them.
For example, a model might use:
- Jointly estimated regression coefficients.
- A multivariate distribution for correlated treatment effects.
- Linked parameters from the same underlying study.
- Appropriate covariance structures.
The assumptions should be documented and tested.
NICE's economic evaluation methods explicitly discuss the need to consider correlations among uncertain parameters.
Probabilistic Sensitivity Analysis Is Not the Same as Microsimulation
This distinction is particularly important in healthcare modeling.
Microsimulation represents individual patient pathways.
Probabilistic sensitivity analysis represents uncertainty in model inputs and the resulting decision outcomes.
They are not competing methods.
A cohort Markov model can use PSA.
A patient-level microsimulation can also use PSA.
In an individual-level simulation, two sources of variation may need to be handled separately.
First-order uncertainty describes random variation in simulated patient pathways.
Second-order uncertainty describes uncertainty in the parameters used to generate those pathways.
Simulating more patients can reduce numerical error associated with patient-level stochastic variation.
It does not eliminate uncertainty in estimated treatment effects, costs, or transition probabilities.
For a more detailed comparison of model structures, see:
Microsimulation vs. Markov Cohort Models
One-Way Sensitivity Analysis vs. PSA
One-way sensitivity analysis changes one parameter at a time while holding other assumptions fixed.
For example, an analyst might vary the cost of an intervention from $5,000 to $15,000.
The model is recalculated at each value.
This helps identify which assumptions materially influence the result.
A tornado diagram can summarize the effect of changing individual inputs.
Probabilistic sensitivity analysis instead evaluates combinations of uncertain parameters according to their specified joint uncertainty distribution.
The methods answer different questions.
| Method | Main Question |
|---|---|
| One-way sensitivity analysis | Which input changes the result most when varied individually? |
| Scenario analysis | What happens under a defined alternative set of assumptions? |
| Probabilistic sensitivity analysis | How does joint parameter uncertainty affect expected outcomes and the preferred decision? |
| Value-of-information analysis | How valuable could additional evidence be for improving the decision? |
These methods complement one another.
PSA does not eliminate the need for structural scenario analysis.
If the model omits a clinically important health state, no amount of parameter sampling will automatically repair that omission.
An ICER Below the Threshold Does Not Prove a Treatment Is Effective
Economic models often combine clinical evidence with assumptions about costs and long-term outcomes.
A favorable economic result depends on the credibility of those clinical inputs.
Suppose treatment effectiveness is estimated from observational healthcare data.
Patients receiving the intervention may differ systematically from patients receiving usual care.
Those differences may create confounding.
A cost-effectiveness model that uses a biased treatment-effect estimate can produce a precise but misleading ICER.
Probabilistic sensitivity analysis can represent uncertainty around the supplied estimate.
It does not automatically remove causal bias from that estimate.
This distinction is essential.
Statistical association describes observed relationships.
Causal effectiveness concerns what would have happened under a different treatment assignment or intervention.
A credible economic evaluation should use appropriately identified treatment-effect evidence and explicitly examine limitations.
When causal evidence is uncertain, the economic conclusion must reflect that limitation.
Why Cost-Effectiveness Is Not the Same as Budget Impact
A treatment can be cost-effective while creating substantial short-term budget pressure.
Suppose a new intervention has positive expected incremental net monetary benefit.
That does not mean a hospital or payer can finance immediate adoption.
The organization may need to consider:
- Number of eligible patients.
- Annual treatment expenditure.
- Upfront implementation costs.
- Staffing and equipment.
- Reimbursement arrangements.
- Timing of cost offsets.
- Capacity constraints.
- Contractual obligations.
Cost-effectiveness analysis evaluates economic value relative to a comparator and a specified decision framework.
Budget impact analysis evaluates the expected financial consequences for a particular budget holder over a defined period.
These are related but distinct analyses.
Decision-makers may need both.
Common Mistakes When Reporting PSA Results
Mistake 1: Reporting Only the Mean ICER
A mean ICER without an uncertainty assessment can conceal important decision instability.
Report incremental costs, QALYs, net benefit, and uncertainty.
Mistake 2: Averaging Individual Simulation ICERs
Averaging cost-effectiveness ratios across draws is not generally equivalent to dividing expected incremental cost by expected incremental effectiveness.
Ratios may also become unstable when incremental effectiveness approaches zero.
Use appropriate incremental expected values and net-benefit methods.
Mistake 3: Treating a CEAC as a Clinical Success Probability
A CEAC reflects modeled economic decision uncertainty conditional on the specified assumptions.
It is not the probability that an individual patient benefits.
Mistake 4: Ignoring Structural Uncertainty
Parameter distributions cannot compensate for an incorrectly specified model.
Alternative model structures may require separate scenario analyses.
Mistake 5: Assuming More Simulations Mean Better Evidence
More Monte Carlo draws can reduce simulation error.
They do not repair poor clinical evidence, omitted variables, or incorrect assumptions.
Mistake 6: Presenting a Threshold as Universal
A willingness-to-pay threshold depends on the decision context.
The $20,000, $30,000, and $40,000 values in this article are hypothetical teaching assumptions.
They are not universal US reimbursement standards or recommendations.
What Should Decision-Makers Request From an Economic Evaluation?
A decision-ready economic evaluation should make its assumptions and limitations visible.
A useful review should include:
- A clearly defined population and comparator.
- The perspective of the analysis.
- The time horizon and discounting assumptions.
- Sources of clinical effectiveness evidence.
- Cost and utility inputs.
- The model structure and validation approach.
- Expected costs and QALYs.
- Incremental cost-effectiveness results.
- Probabilistic sensitivity analysis.
- Relevant deterministic and structural scenarios.
- Decision uncertainty and value-of-information analysis when appropriate.
- Practical implementation and budget considerations.
These items should be interpreted within the reporting requirements of the relevant decision-making setting.
The CHEERS 2022 statement provides guidance on transparent reporting of health economic evaluations.
CHEERS is a reporting framework.
It is not a numerical quality score or a guarantee that an evaluation's underlying methods are valid.
Official reference:
https://www.ispor.org/heor-resources/good-practices/cheers
The Bottom Line: Decision Uncertainty Matters More Than a Single Attractive ICER
Our hypothetical intervention had:
Expected incremental cost:
$8,000.
Expected incremental QALYs:
0.285.
Expected ICER:
Approximately $28,070 per QALY.
At a hypothetical threshold of $30,000 per QALY:
Expected incremental net monetary benefit:
$550 per patient.
Illustrative favorable scenario proportion:
75%.
Expected value of perfect information:
$550 per patient.
These results tell a richer story than the ICER alone.
The intervention has positive expected net monetary benefit under the assumed uncertainty model.
But some plausible scenarios favor existing care.
Perfect information could improve the decision, although real research cannot generally eliminate all uncertainty.
The objective of probabilistic sensitivity analysis is not to make a model look more sophisticated.
It is to connect uncertain evidence to transparent decisions.
A healthcare economic model should help decision-makers understand not only which option appears preferable, but also how robust that conclusion is, what assumptions drive it, and when additional evidence may be worth obtaining.
References and Methodological Notes
National Institute for Health and Care Excellence (NICE).
Technology appraisal and highly specialised technologies guidance: the manual.
Economic evaluation section.
Published January 31, 2022; updated October 13, 2026.
https://www.nice.org.uk/process/pmg36/chapter/economic-evaluation-2/
Briggs AH, Weinstein MC, Fenwick E, et al.
Model Parameter Estimation and Uncertainty Analysis: A Report of the ISPOR-SMDM Modeling Good Research Practices Task Force-6.
Value in Health. 2012;15(5):835–842.
ISPOR.
Consolidated Health Economic Evaluation Reporting Standards (CHEERS) 2022.
Husereau D, Drummond M, Augustovski F, et al.
Consolidated Health Economic Evaluation Reporting Standards 2022: Updated Reporting Guidance for Health Economic Evaluations.
Methodological Note
All numerical examples are original hypothetical teaching illustrations.
The four equally weighted scenarios are not a fully specified probabilistic sensitivity analysis based on empirical parameter distributions.
Their favorable proportions and value-of-information results are conditional on the illustrative discrete uncertainty model.
They are not clinical findings, reimbursement recommendations, actual UAD Consulting research results, or empirical estimates of healthcare treatment effectiveness.
The examples assume a two-option decision, a risk-neutral expected-net-benefit framework, consistent per-patient incremental costs and QALYs, and no additional adoption constraints.
A real economic evaluation must justify clinical effectiveness, cost and utility inputs, parameter distributions, dependencies, model structure, time horizon, discounting, and the relevant decision threshold.
Make Healthcare Decisions More Transparent
Economic models should make uncertainty visible, not hide it behind one result.
UAD Consulting works with healthcare data, cost-effectiveness analysis, simulation, and decision modeling to support evidence-based evaluation of costs, outcomes, and alternatives.
Explore our Health Economics & Outcomes Research services or get in touch to discuss your project.
Explore ServicesGet in Touch