Insights on analytics, data-driven decision-making, and applied research.
Business Analytics & Data Science
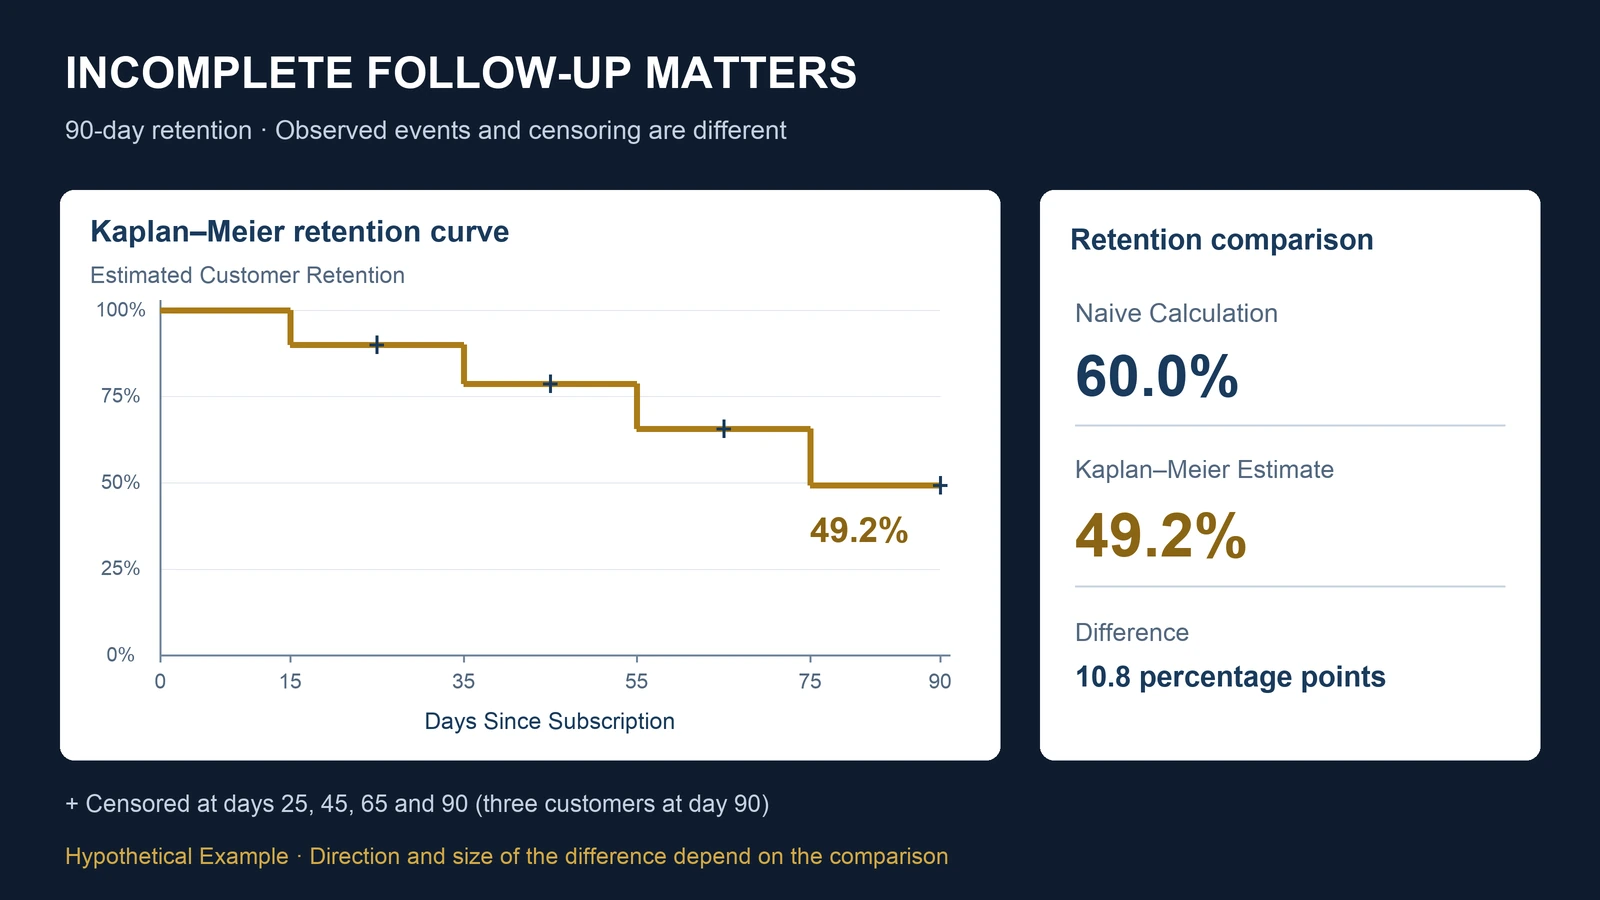
Is Your 90-Day Customer Retention Rate Misleading?
A company reports 60% customer retention, but some customers have not completed their observation period. Learn how right-censoring and Kaplan–Meier analysis change the interpretation of retention data.
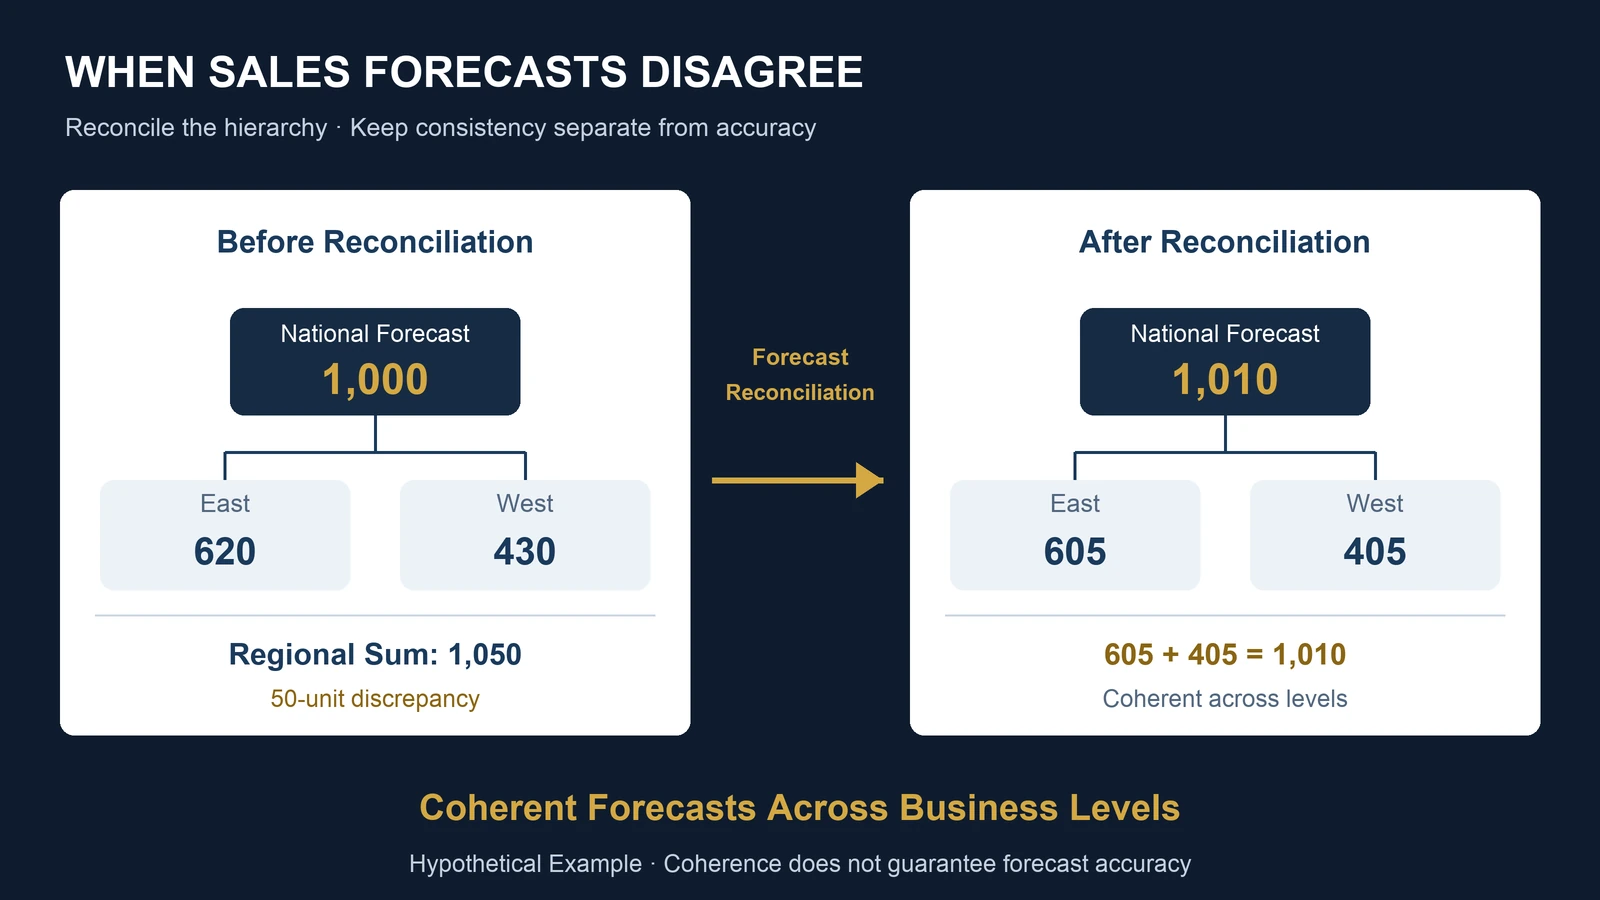
Why Doesn't Your Sales Forecast Add Up Across Regions?
Your national sales forecast predicts 1,000 units, but regional forecasts add up to 1,050. Which number should management trust? Learn how hierarchical forecasting and reconciliation create consistent predictions.
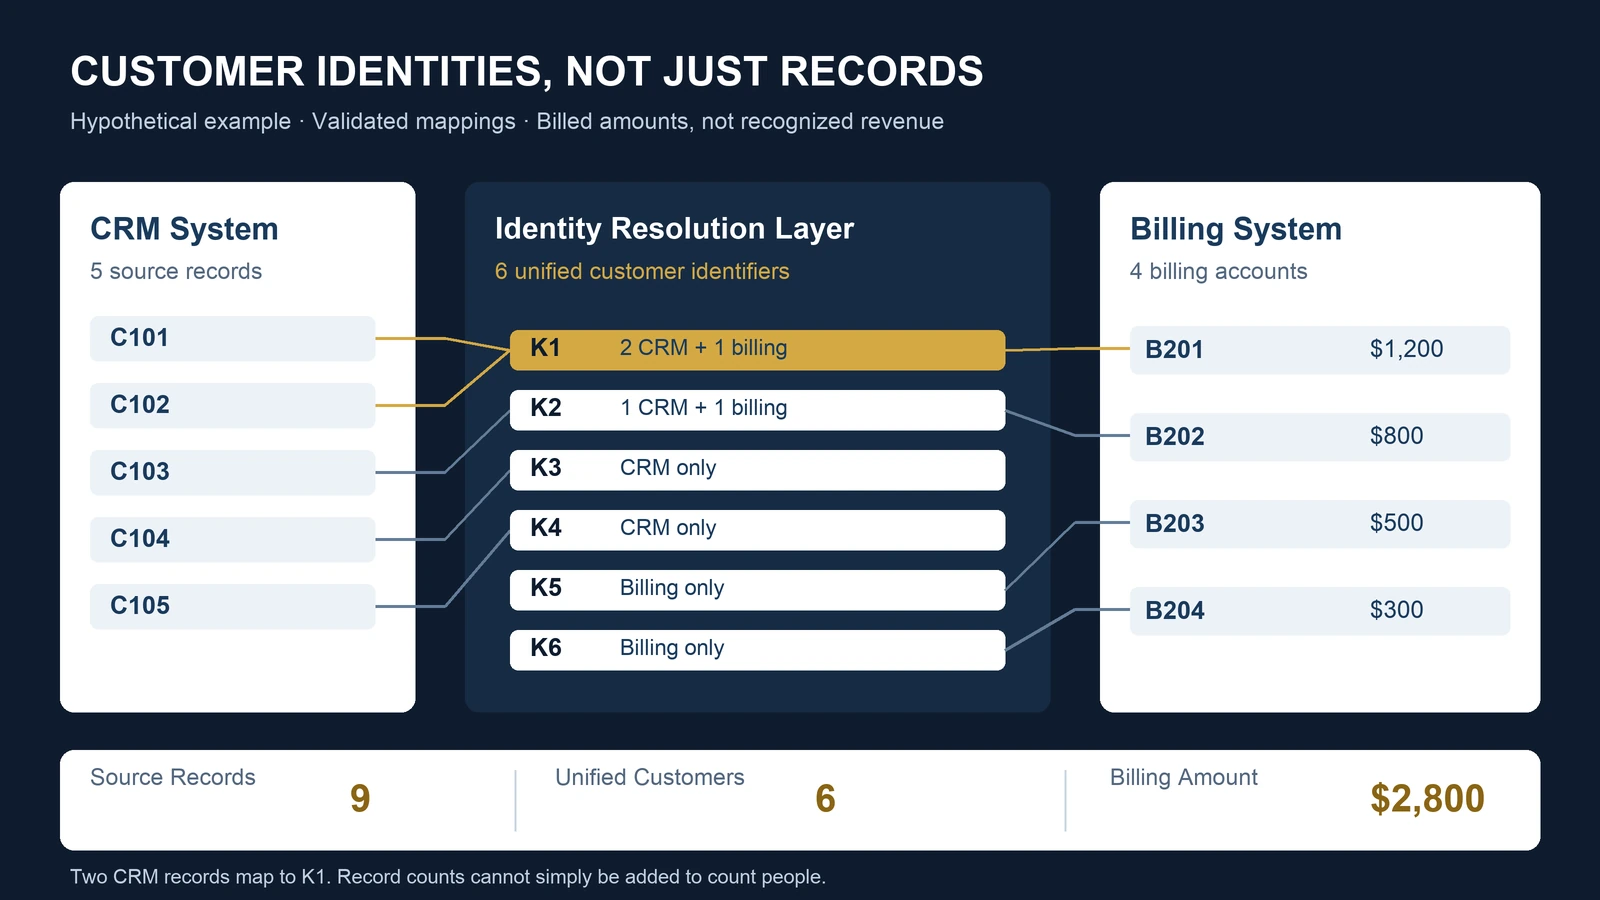
Why Don't CRM and Billing Customer Counts Match? A Practical Guide to Identity Resolution
Five CRM records and four billing accounts may represent six customers—not nine. Learn how identity resolution, customer keys, and SQL prevent misleading customer and revenue reporting.
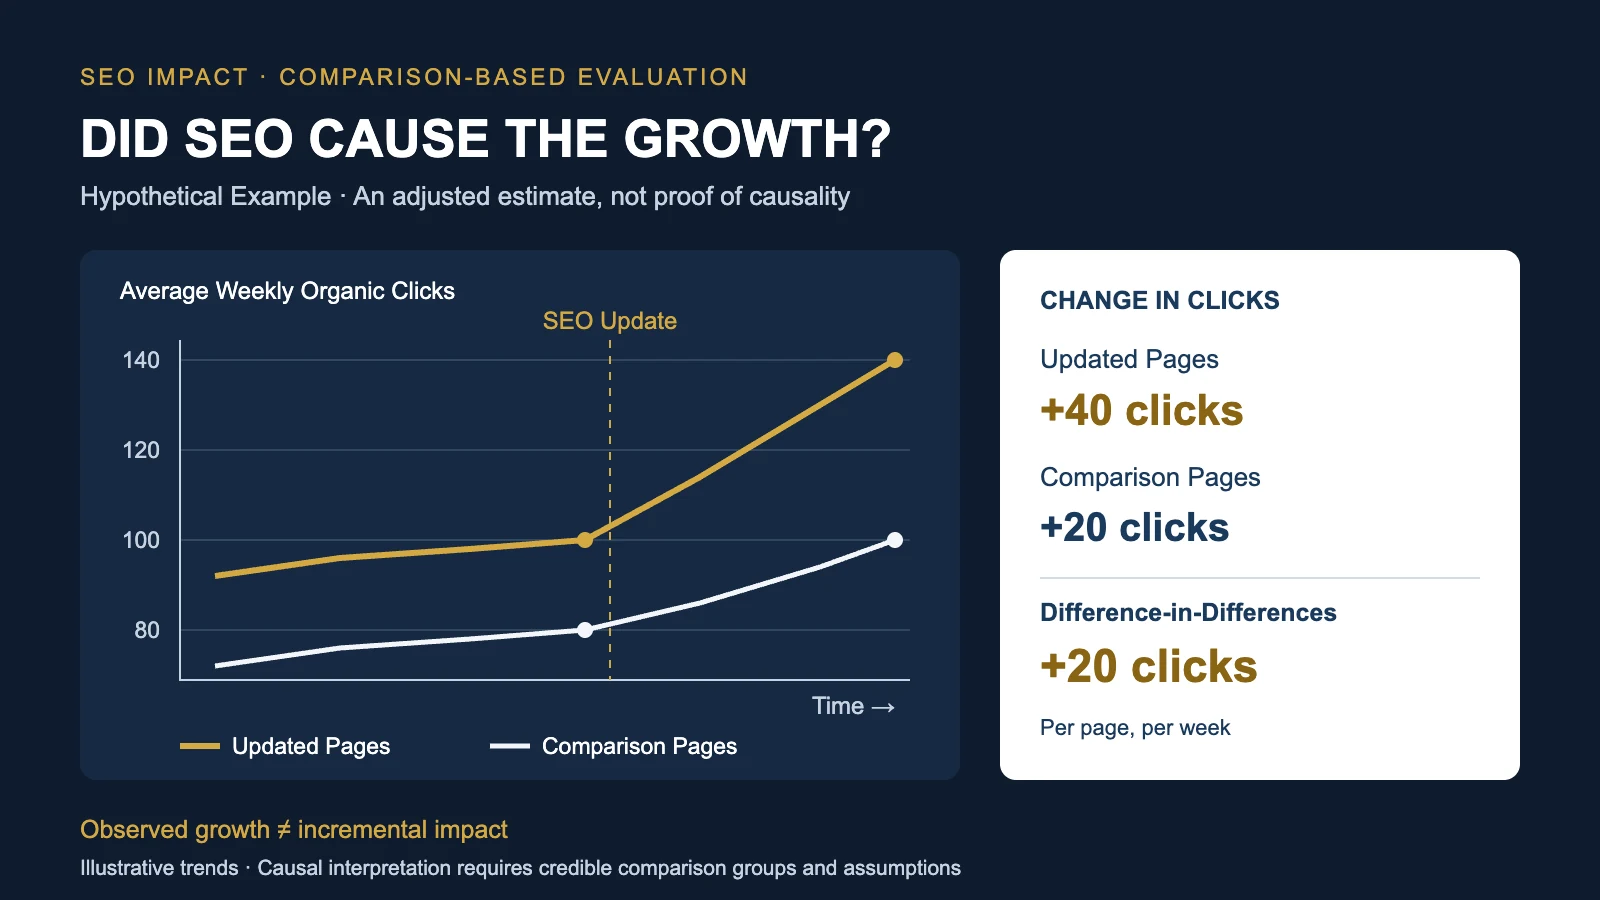
Did Your SEO Changes Actually Increase Organic Traffic?
Organic clicks increased after an SEO update. But how much of that growth would have happened anyway? Learn how difference-in-differences, comparison pages, and careful assumptions can improve SEO impact evaluation.
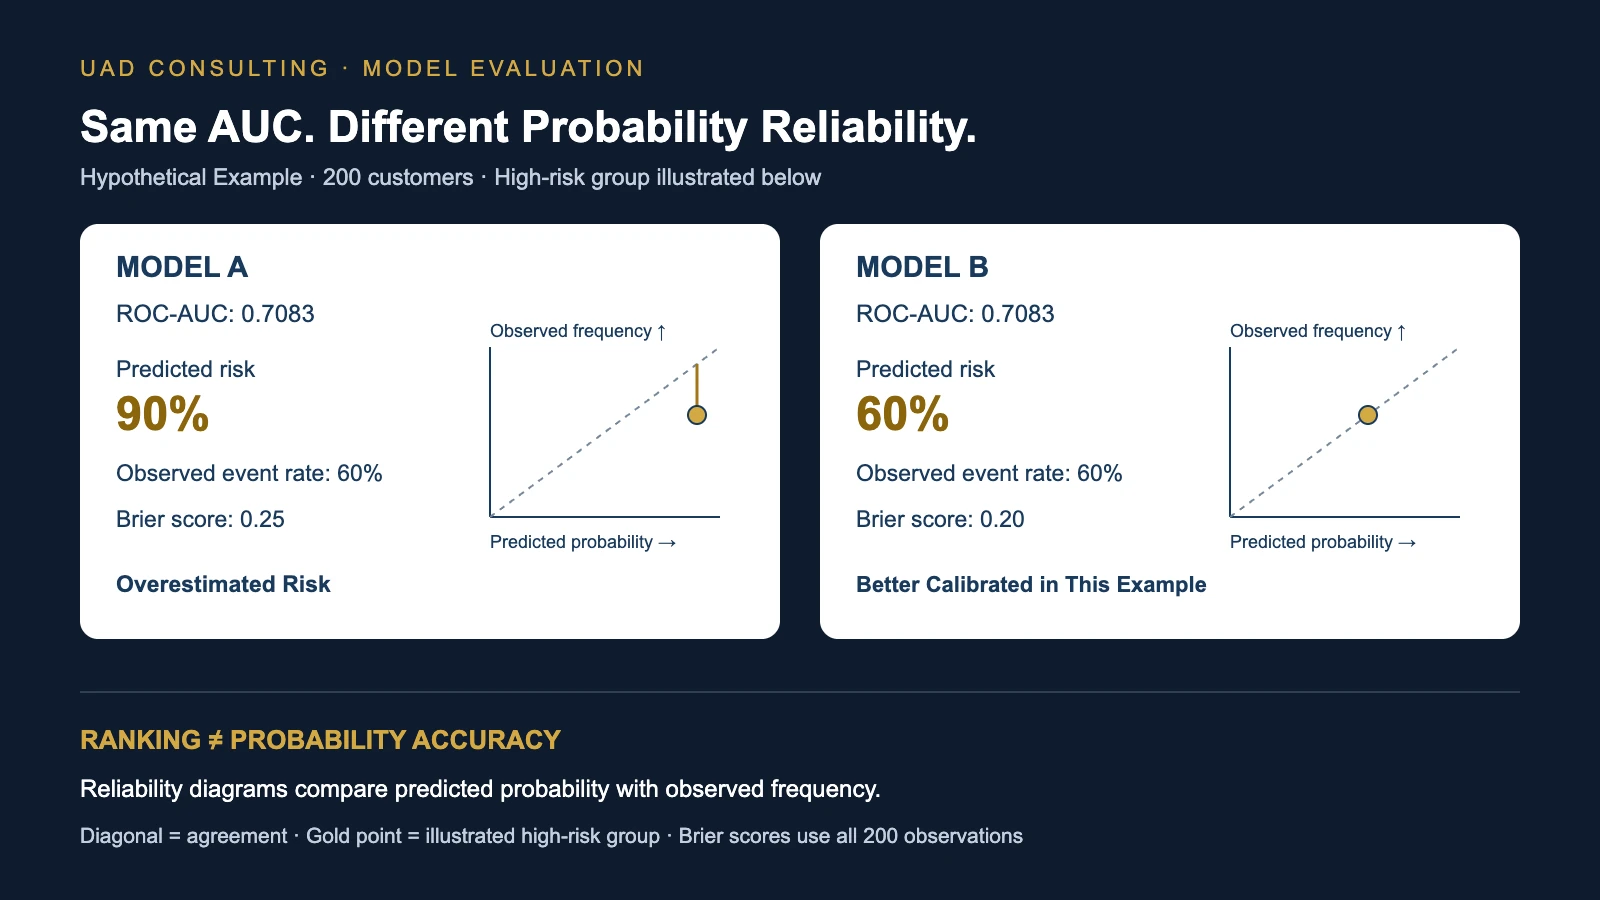
Your Model Has a Good AUC. Can You Trust Its Probabilities?
Two machine learning models have identical AUC scores, but one substantially overestimates risk. Learn how probability calibration, Brier scores, and decision costs reveal differences that classification metrics can miss.
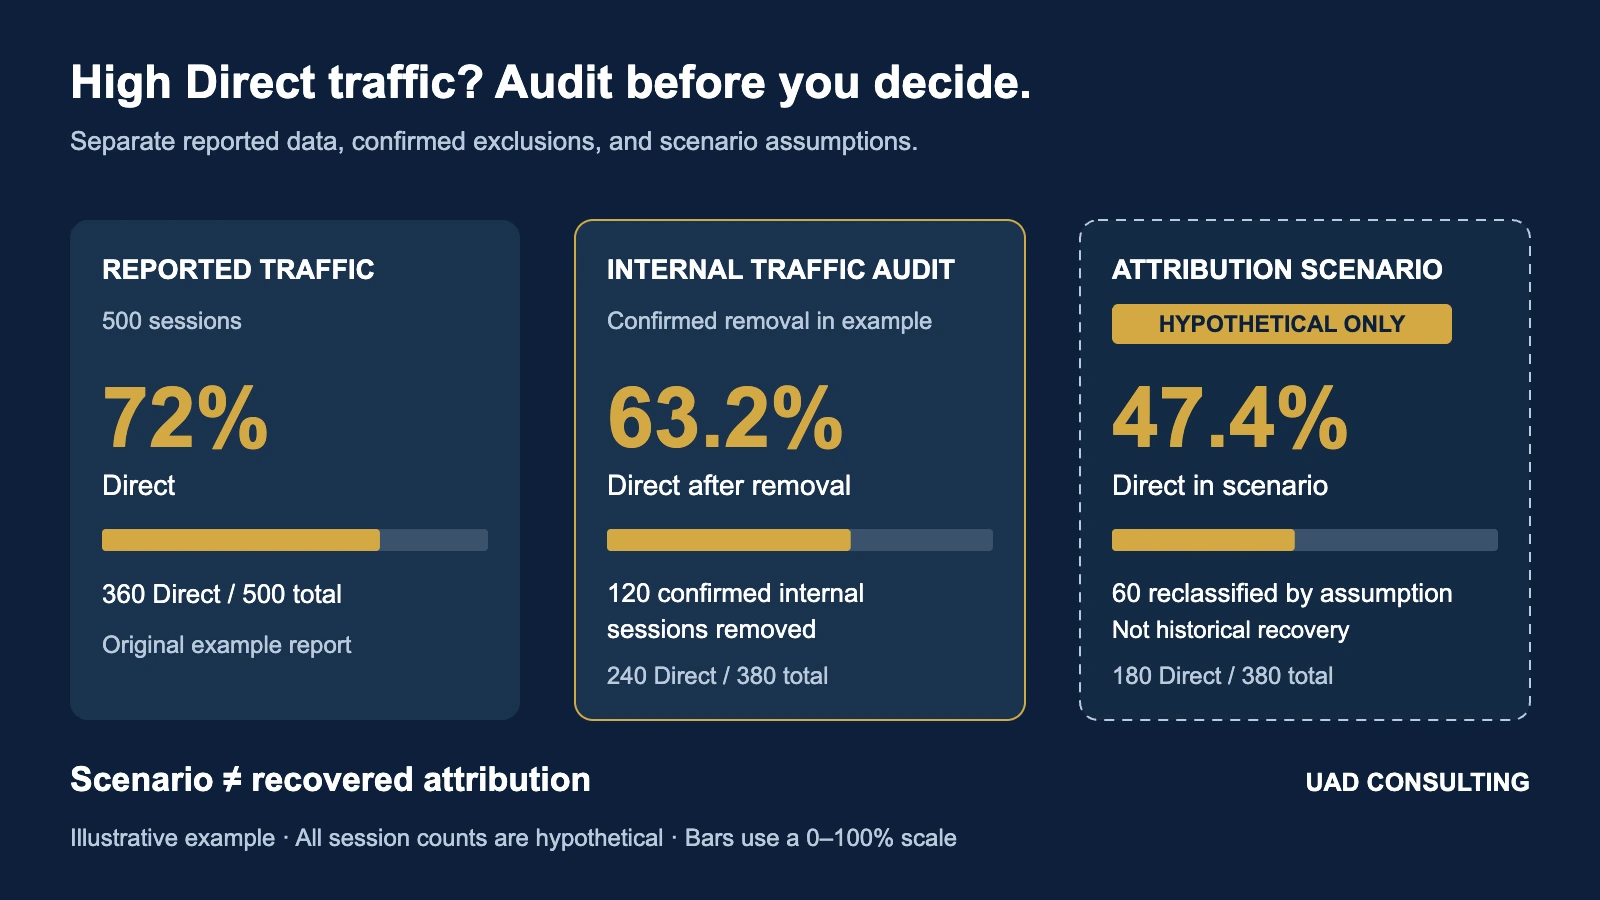
Why Is Most of My GA4 Traffic Direct? An Audit Before You Trust the Number
A high Direct traffic percentage does not necessarily mean visitors typed your website address. Learn how to audit internal visits, missing campaign data, and attribution with a practical worked example.
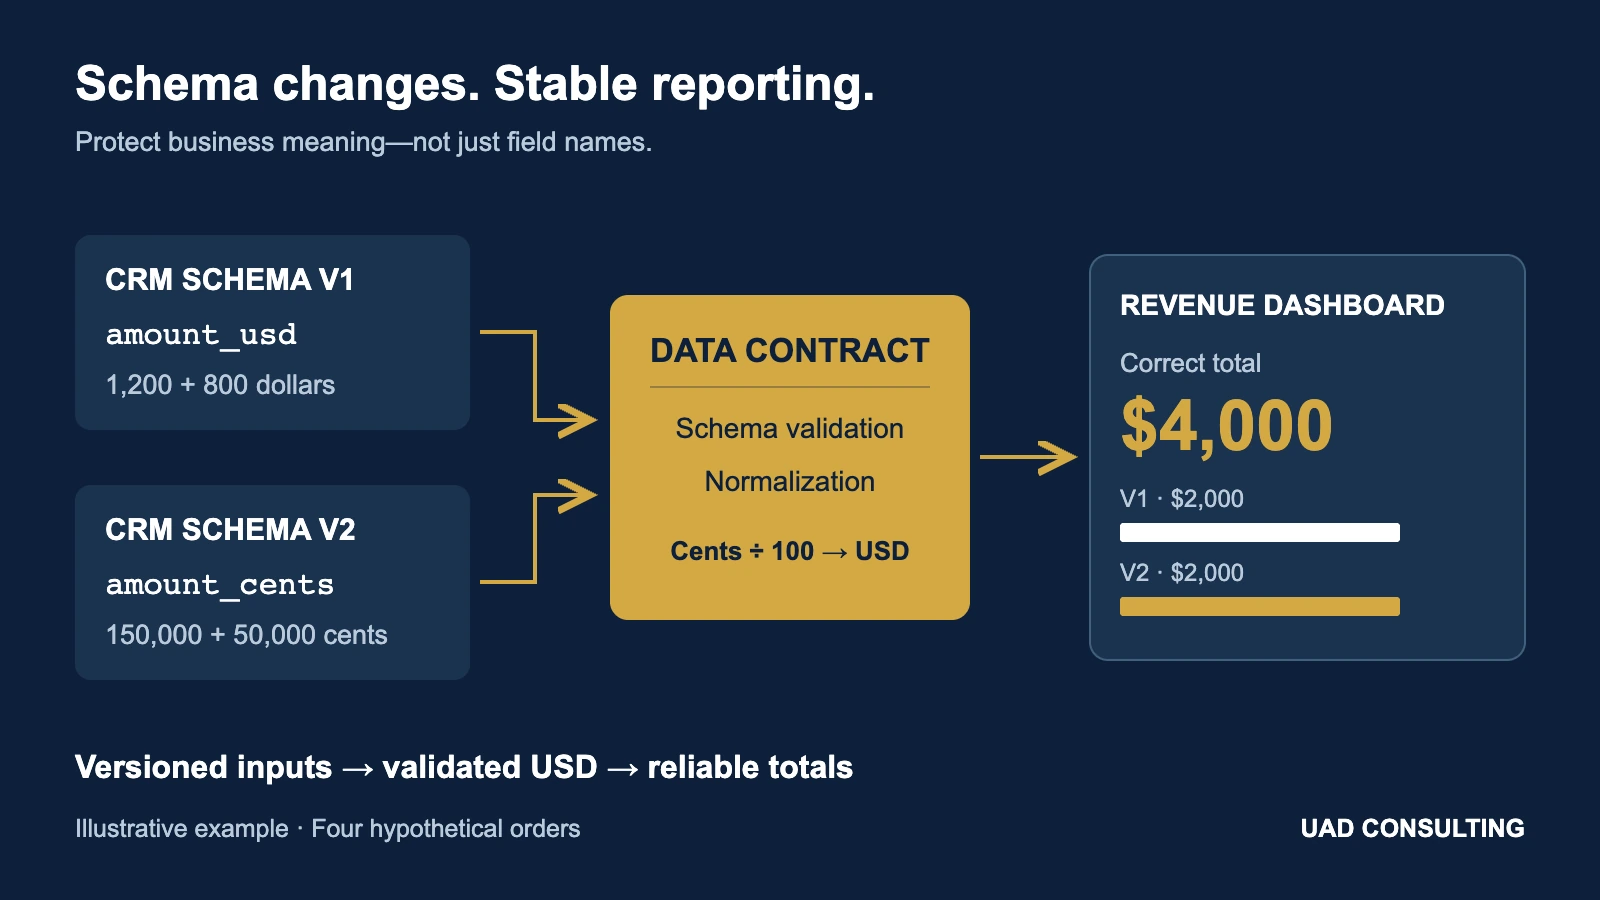
Your CRM Changed One Field. Why Did the Revenue Dashboard Break?
One CRM field change can break an entire reporting pipeline. Learn how data contracts, schema versioning, and automated checks protect revenue dashboards from silent errors.
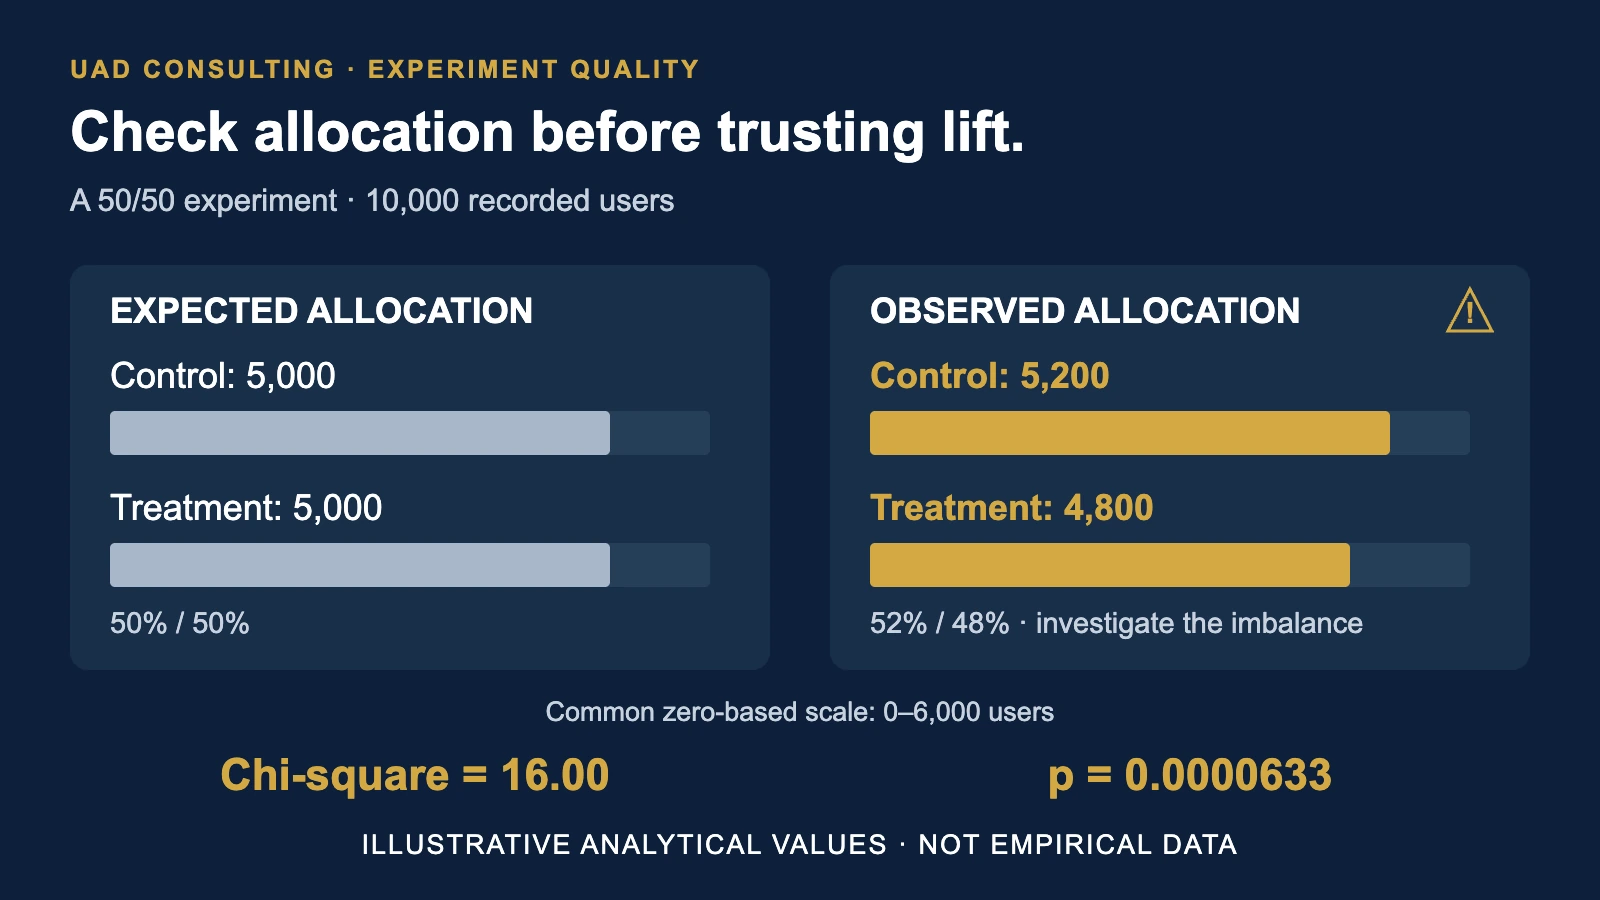
Your A/B Test Shows a 20% Lift. Can You Trust the Result?
Your A/B test shows a 20% conversion lift, but did users split correctly between groups? Learn how sample ratio mismatch can reveal experiment problems before rollout.
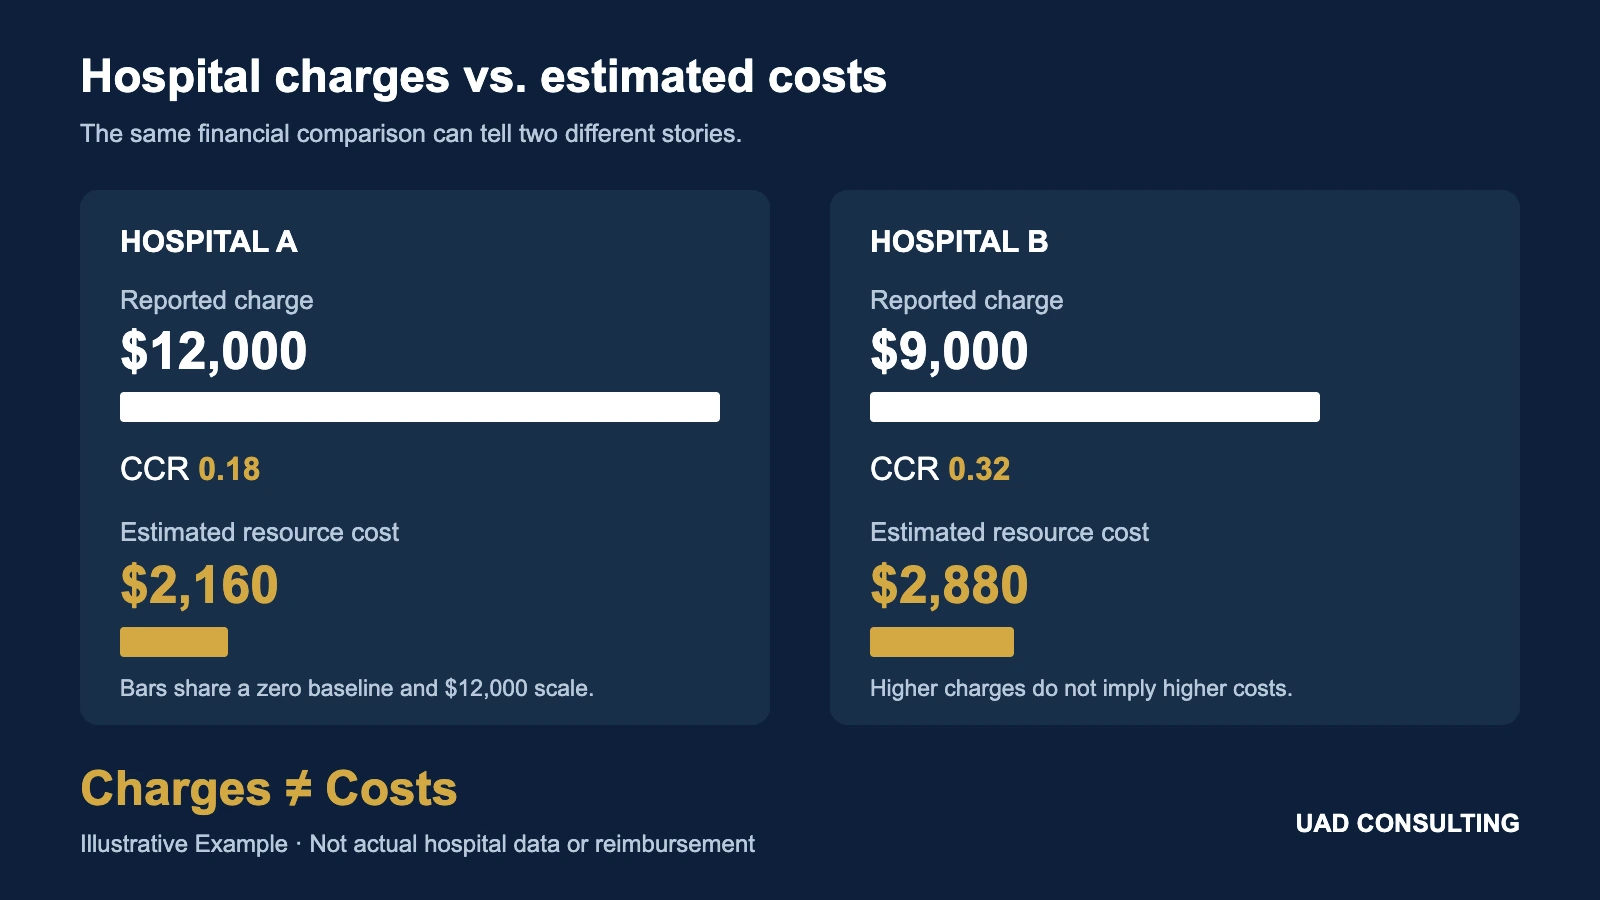
A hospital bills $12,000 for an emergency visit. What did the care actually cost? Learn how cost-to-charge ratios, HCUP data, and economic assumptions change the answer.
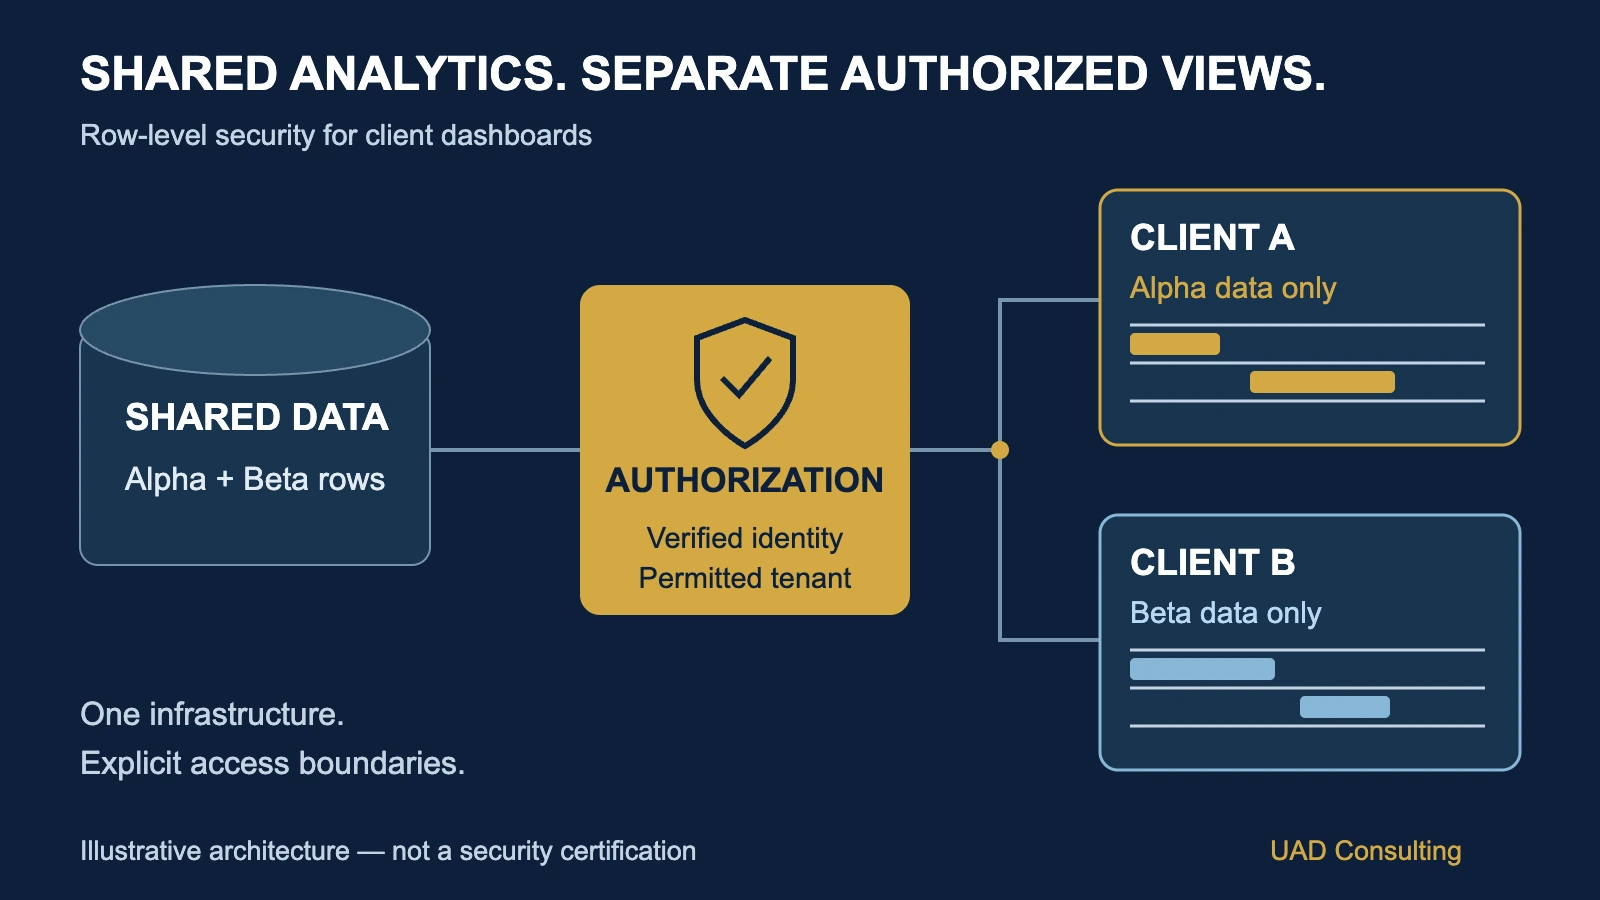
How Can One Dashboard Serve Multiple Clients Without Exposing Their Data?
Can one analytics dashboard safely serve multiple clients? Learn how row-level security, database permissions, identity mapping, and access testing help protect client-specific reporting.
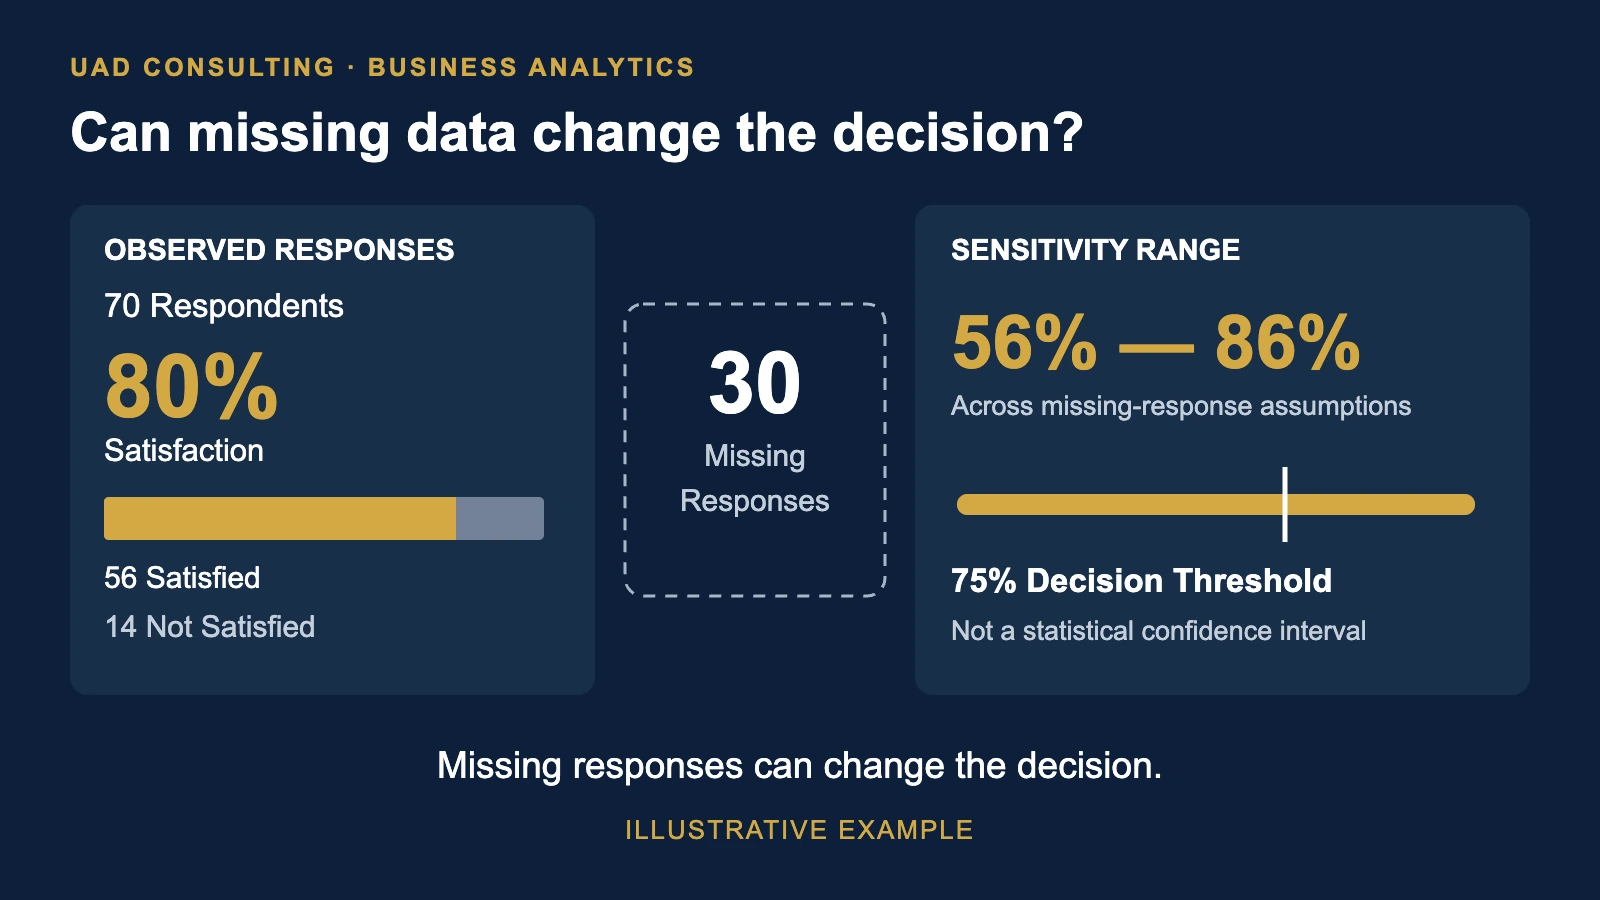
A survey reports 80% customer satisfaction, but 30% of customers never responded. Learn how missing data, imputation assumptions, and sensitivity analysis can change the interpretation—and the decision.