A company tests a redesigned checkout page.
Half of its website visitors are supposed to see the existing checkout experience.
The other half are supposed to see a redesigned version.
After two weeks, the analytics dashboard reports encouraging results.
The existing checkout converts 10% of visitors.
The redesigned checkout converts 12%.
Management calculates a 20% relative improvement and prepares to launch the new version.
But an analyst notices something unusual.
The experiment was configured to allocate visitors equally between the two groups.
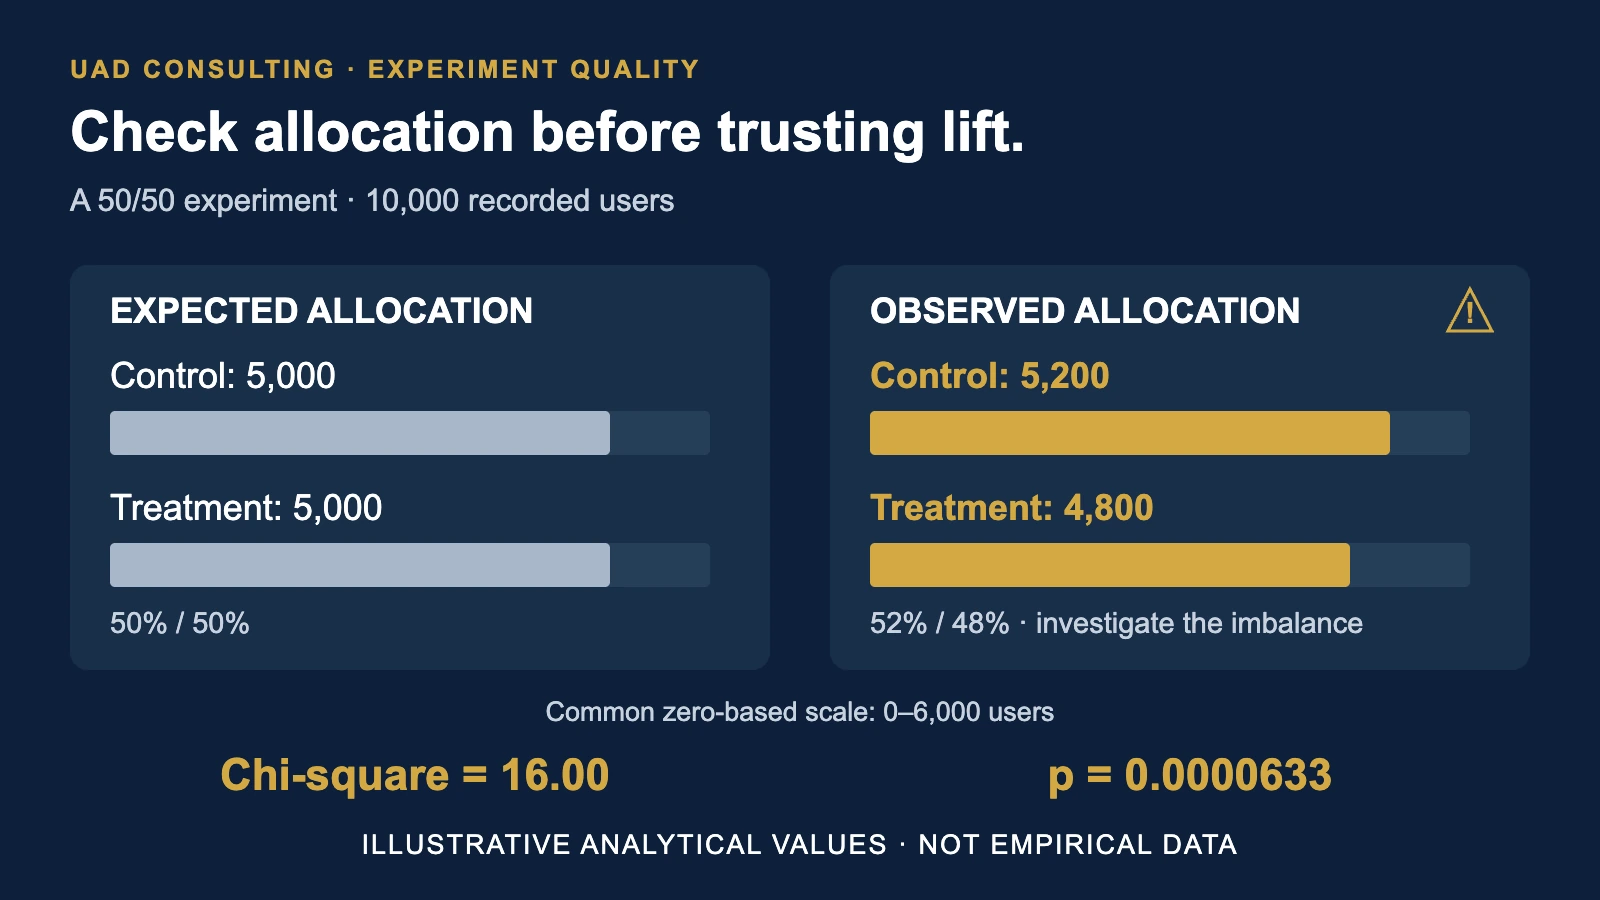
Instead, the recorded experiment population contains 5,200 control users and 4,800 treatment users.
Does this difference matter?
Could it simply be random variation?
And if the allocation is wrong, can management still trust the reported conversion improvement?
These questions lead to an important concept in experimentation:
Sample Ratio Mismatch.
The Short Answer: Check Experiment Allocation Before Interpreting Lift
Sample Ratio Mismatch, commonly abbreviated SRM, occurs when the observed distribution of experiment units differs unexpectedly from the configured allocation.
For example, an experiment may be designed to assign 50% of eligible users to Control and 50% to Treatment.
An observed split of 52% and 48% does not automatically prove that the experiment was implemented incorrectly.
Random allocation naturally produces some variation.
However, statistical testing can help determine whether the observed imbalance is unusually large under the configured randomization mechanism.
A statistically significant SRM is a warning that the experiment requires investigation.
Possible explanations include:
- Incorrect assignment logic.
- Missing exposure events.
- Inconsistent user identifiers.
- Differential tracking failures.
- Post-assignment filtering.
- Bot detection or eligibility changes.
- Users entering multiple variants.
- Incorrect assumptions about the allocation ratio.
SRM does not identify the root cause by itself.
It also does not prove that the estimated treatment effect is biased.
But until the discrepancy is understood, the causal interpretation of the experiment may be unreliable.
What Is Sample Ratio Mismatch?
An A/B test typically uses a randomization mechanism to allocate eligible experimental units to different conditions.
Those units might be:
Individual users.
Accounts.
Organizations.
Stores.
Geographic markets.
Sessions.
The correct unit depends on the experiment design.
For a user-randomized website experiment, each eligible user should ordinarily receive a stable assignment to one experiment variant.
Suppose the intended allocation is:
Control: 50%.
Treatment: 50%.
With 10,000 assigned users, the expected counts are:
Control: 5,000.
Treatment: 5,000.
Actual counts will generally not be exactly equal when independent random assignment is used.
For example, 5,030 versus 4,970 would not be surprising.
But larger differences may warrant investigation.
The important question is not whether the two counts are identical.
It is whether the observed difference is consistent with the intended randomization process.
A Worked Example: A 20% Conversion Lift With an Allocation Warning
Consider a hypothetical ecommerce company.
The company tests a redesigned checkout page.
The experiment is configured for a 50/50 user allocation.
The company records the following results:
| Metric | Control | Treatment |
|---|---|---|
| Recorded users | 5,200 | 4,800 |
| Conversions | 520 | 576 |
| Conversion rate | 10.0% | 12.0% |
| Expected users | 5,000 | 5,000 |
These numbers are hypothetical.
They are designed to illustrate experiment diagnostics rather than describe a real company's performance.
Step 1: Calculate the observed conversion difference
Control conversion rate:
Treatment conversion rate:
Absolute conversion-rate difference:
Relative conversion lift:
(12% - 10%) / 10% = 20%.
The treatment group has a 20% higher observed conversion rate.
But that is a descriptive comparison.
It becomes evidence of a causal treatment effect only under a credible experimental design and appropriate measurement assumptions.
Step 2: Compare expected and observed allocations
The experiment contains 10,000 recorded users.
Under the configured 50/50 split:
Expected Control = 5,000.
Expected Treatment = 5,000.
Observed Control = 5,200.
Observed Treatment = 4,800.
The control group contains 200 more users than expected.
The treatment group contains 200 fewer users than expected.
The observed allocation is:
52% Control.
48% Treatment.
The difference may appear small.
But the size of an allocation difference must be interpreted relative to sample size.
That is why statistical testing matters.
How Does the Chi-Square SRM Test Work?
A common SRM diagnostic is the chi-square goodness-of-fit test.
It compares observed experiment counts with the counts expected under the configured allocation.
For categories indexed by i:
Chi-square = SUM[(Observed_i - Expected_i)^2 / Expected_i]
For the hypothetical checkout experiment:
Control contribution:
(5,200 - 5,000)^2 / 5,000
= 40,000 / 5,000
= 8.
Treatment contribution:
(4,800 - 5,000)^2 / 5,000
= 40,000 / 5,000
= 8.
Total chi-square statistic:
For two categories, the goodness-of-fit test has one degree of freedom under the standard setup.
The corresponding p-value is approximately:
0.0000633.
This is equivalent to approximately 6.33 × 10^-5.
Under the specified randomization model, an allocation imbalance this extreme or more extreme would be very unlikely to arise by chance alone.
This result provides strong evidence against the expected 50/50 allocation model.
It does not establish exactly what went wrong.
Why the p-value matters
A p-value is not the probability that the experiment is valid.
It is also not the probability that the treatment effect is real.
Here, it describes how unusual the observed allocation would be under the expected randomization process.
Different experimentation platforms may use different alert thresholds.
For example, an organization might predefine an SRM investigation threshold of p < 0.001.
The hypothetical result would trigger an investigation under that rule.
Thresholds should be chosen before inspecting experiment outcomes.
They should also reflect the platform's monitoring strategy and the consequences of false alerts.
Why a Statistically Significant Conversion Lift Does Not Fix SRM
Suppose the company performs a conventional statistical comparison of conversion rates.
The treatment group appears to outperform the control group.
Management might conclude:
"The conversion improvement is statistically significant, so the new checkout must be better."
That conclusion would be premature.
A conventional outcome test assumes that the data being analyzed appropriately represent the experiment.
If treatment assignment, exposure logging, or sample inclusion is compromised, the resulting comparison may be biased.
A very small outcome p-value does not repair a broken randomization or measurement process.
This distinction is fundamental.
The SRM diagnostic asks:
"Does the experiment population match the intended allocation mechanism?"
The outcome analysis asks:
"How different are the measured outcomes between experimental groups?"
These are separate questions.
Both matter.
An experiment can show a large outcome difference while failing an allocation-integrity check.
Conversely, an experiment can pass SRM while still suffering from other problems.
Passing SRM is necessary as a useful quality diagnostic in many experiments, but it is not sufficient to establish overall experimental validity.
What Can Cause Sample Ratio Mismatch?
SRM is a symptom.
Diagnosing the cause requires examining how users enter the experiment, how assignments are recorded, and how the analytical population is constructed.
1. Incorrect randomization implementation
An experiment may be configured for a 50/50 allocation.
But the assignment system may not implement that ratio correctly.
For example, a configuration change might unintentionally route more users to Control.
A bug in hashing or bucketing logic could create another imbalance.
The first diagnostic question is:
Does the assignment system itself produce the expected allocation?
2. Missing exposure events
Assignment and exposure are not always the same event.
A user may be assigned to Treatment but never actually load the redesigned page.
A browser may fail to send the expected tracking event.
An application may record Control exposures more reliably than Treatment exposures.
If the analysis includes only users with recorded exposure events, the observed group sizes may become distorted.
This is especially concerning when exposure recording depends on behavior affected by the treatment.
3. Post-assignment filtering
Suppose a website experiment randomizes users correctly.
But the analysis excludes visitors who fail to complete a later interaction.
If that interaction is influenced by the treatment, the exclusion may change group composition.
For example, excluding users who do not reach the payment page could create selection bias when the treatment itself affects whether users reach that page.
Randomization occurs at assignment.
Filtering based on post-treatment behavior can undermine the comparability that randomization was intended to create.
4. Identity and deduplication problems
One visitor may generate multiple sessions.
A user may switch devices.
A cookie may expire.
An identity system may merge or split user records.
If assignment occurs at the user level but analysis counts sessions, the observed allocation may not reflect the intended randomization unit.
A valid diagnostic should count the units that were randomized.
For a user-randomized experiment, that generally means distinct eligible user identifiers, not raw page views or event rows.
5. Users appearing in multiple variants
A user should ordinarily remain in the same variant throughout a conventional user-randomized experiment.
If a user appears in both Control and Treatment assignment records, the experiment may have an identity or bucketing problem.
Simply counting distinct users within each variant can hide this issue.
The same user may be counted once in each group.
Therefore, the audit should also identify units associated with more than one variant.
6. Incorrect expected allocation
Not every experiment is designed for a 50/50 split.
A company may intentionally allocate:
90% to Control.
10% to Treatment.
Or:
80% to Control.
20% to Treatment.
An SRM test must use the allocation probabilities actually configured for the eligible population during the relevant period.
If the intended ratio changed during the experiment, the analysis must account for those changes appropriately.
Testing a valid 90/10 experiment against a 50/50 expectation would produce a misleading warning.
A Practical SQL Audit for Experiment Assignment
Before analyzing conversions, an analyst can inspect the underlying assignment records.
Consider a hypothetical table:
experiment_assignments
With the following columns:
experiment_id
user_id
variant
assigned_at
Assume the experiment is randomized at the user level.
The following SQL is an illustrative PostgreSQL-compatible audit.
It counts users by variant and separately identifies users recorded in more than one variant.
WITH user_assignments AS (
    SELECT
        experiment_id,
        user_id,
        COUNT(DISTINCT variant) AS variant_count,
        MIN(variant) AS assigned_variant
    FROM experiment_assignments
    WHERE experiment_id = 'checkout_v2'
      AND user_id IS NOT NULL
      AND variant IN ('control', 'treatment')
    GROUP BY
        experiment_id,
        user_id
)

SELECT
    COUNT(*) AS total_users,

    SUM(
        CASE
            WHEN variant_count = 1
             AND assigned_variant = 'control'
            THEN 1 ELSE 0
        END
    ) AS control_users,

    SUM(
        CASE
            WHEN variant_count = 1
             AND assigned_variant = 'treatment'
            THEN 1 ELSE 0
        END
    ) AS treatment_users,

    SUM(
        CASE
            WHEN variant_count > 1
            THEN 1 ELSE 0
        END
    ) AS conflicting_users

FROM user_assignments;
The query separates users with a single recorded variant from users with conflicting assignments.
It does not automatically repair conflicting records.
It also does not establish that the recorded assignment table contains every eligible randomized user.
Additional checks may be required for missing assignments, unexpected variant values, duplicate identifiers, and tracking failures.
For a trustworthy SRM test, the analyst should first define the correct experimental population and confirm the intended allocation probabilities.
What should be checked next?
Compare the number of users at three important stages:
| Stage | Question |
|---|---|
| Assignment | How many eligible users were randomized? |
| Exposure | How many users actually encountered the experience? |
| Analysis | How many users remained in the outcome dataset? |
Investigate whether the allocation changes between these stages.
For example, if assignment counts are balanced but exposure counts are not, the issue may arise after randomization.
If assignment counts are already imbalanced, the problem may involve the randomization mechanism, eligibility rules, or assignment logging.
These comparisons help localize the problem.
They do not establish causality without further investigation.
Reproducing the Chi-Square Calculation in Python
The SRM calculation can also be reproduced programmatically.
For a two-group goodness-of-fit test, the following Python example uses only the standard library.
from math import erfc, sqrt

observed = [5200, 4800]
expected_ratio = [0.5, 0.5]

total = sum(observed)

expected = [
    total * ratio
    for ratio in expected_ratio
]

chi_square = sum(
    (obs - exp) ** 2 / exp
    for obs, exp in zip(observed, expected)
)

# For a chi-square distribution
# with one degree of freedom:
p_value = erfc(sqrt(chi_square / 2))

print(f"Chi-square: {chi_square:.2f}")
print(f"P-value: {p_value:.8f}")
Expected output:
Chi-square: 16.00
P-value: 0.00006334
This calculation assumes two mutually exclusive groups and a valid fixed expected allocation model.
For experiments with additional variants, different allocation probabilities, or more complicated assignment structures, the diagnostic should be adapted.
For a production experimentation system, use validated statistical software and platform-specific diagnostics.
What Should a Business Do When an Experiment Fails SRM?
A failed SRM check should trigger a structured investigation.
It should not automatically trigger a product rollout.
It should also not automatically be interpreted as proof that the treatment performed poorly.
A useful response involves five stages.
Stage 1: Pause the rollout decision
Do not interpret the apparent lift as reliable causal evidence until the allocation issue has been investigated.
If the experiment affects important financial or customer outcomes, the consequences of acting on unreliable evidence may be substantial.
Stage 2: Verify the experiment configuration
Confirm:
The intended allocation ratio.
The randomization unit.
The eligibility criteria.
The experiment start date.
Any changes to allocation rules.
Whether users could enter more than one experiment.
Whether the assignment process was stable throughout the test.
Stage 3: Audit the data pipeline
Compare assignment records, exposure events, and analytical inclusion rules.
Check for:
Missing events.
Duplicate identities.
Unexpected exclusions.
Cross-variant users.
Tracking differences.
Platform-specific logging problems.
Data processing failures.
The objective is to determine where the unexpected imbalance first appears.
Stage 4: Determine whether the problem is recoverable
Some issues may be traceable to a clearly understood measurement or processing error.
For example, an analyst may discover that a reporting query accidentally excluded a known subset of users.
If complete, trustworthy source records remain available, the analytical dataset may be rebuilt using the correct rules.
But not every experiment can be repaired after the fact.
If treatment assignment was compromised or missing data cannot be recovered, a new experiment may be necessary.
A statistical adjustment does not automatically restore the validity of broken randomization.
Stage 5: Document the decision
The final experiment report should explain:
What failed.
How it was diagnosed.
Which users or records were affected.
Whether the root cause was resolved.
Whether the treatment-effect estimate remains interpretable.
Whether the experiment was rerun.
A transparent conclusion may be:
"The experiment showed a 20% observed conversion-rate difference, but an unresolved allocation mismatch prevents a reliable causal interpretation."
That is more useful than publishing a misleading success metric.
Does Passing an SRM Test Prove That an A/B Test Is Valid?
No.
A passing SRM check is useful, but it does not establish that the entire experiment was correctly implemented.
An experiment may have approximately equal group sizes while suffering from other problems.
For example:
The same users may appear in both variants.
The treatment may not actually be delivered.
The conversion event may be recorded incorrectly.
Users may influence one another across groups.
The outcome definition may change during the test.
The experiment may have insufficient statistical power.
The business may examine many outcomes and selectively report only favorable results.
A 50/50 allocation does not resolve these issues.
SRM should therefore be part of a broader experiment quality-assurance process.
A/B Testing, Attribution, and Incrementality Answer Different Questions
Experiment diagnostics should not be confused with marketing attribution.
Attribution describes how observed customer interactions receive conversion credit.
For example, a customer may interact with paid social, organic search, and email before making a purchase.
An attribution model distributes credit across those observed touchpoints.
But attribution does not automatically establish whether a marketing activity caused an additional purchase.
Incrementality attempts to estimate that causal effect.
A properly designed randomized experiment can help estimate the difference between outcomes with and without an intervention.
However, experimental results are only as credible as the design and implementation supporting them.
An SRM diagnostic helps evaluate one part of that credibility.
For a related discussion, see UAD Consulting's article:
Marketing Attribution vs. Incrementality: What Actually Drove Growth?
The important distinction is:
Attribution assigns credit within observed journeys.
Incrementality estimates additional outcomes caused by an intervention.
SRM evaluates whether the recorded experiment allocation is consistent with the intended assignment process.
These are complementary, not interchangeable, analytical concepts.
What If the Business Cannot Run a Randomized Experiment?
Randomized experiments are not always feasible.
A company may already have implemented a change.
A policy may affect an entire geographic market.
Operational constraints may prevent random assignment.
In those situations, quasi-experimental methods can sometimes help estimate the impact of an intervention.
Difference-in-differences, for example, compares changes in outcomes between treated and comparison groups.
But its credibility depends on assumptions about how those groups would have evolved without treatment.
Unlike randomized experiments, observational comparisons cannot rely on random assignment to support baseline comparability.
For a practical example, see:
Did the Change Actually Work? Measuring Business Impact Without an A/B Test
The broader lesson is that causal interpretation must follow from the research design.
A statistically significant association does not, by itself, establish causality.
An Experiment Quality Checklist for Business Teams
Before making a rollout decision, a business should answer the following questions.
1. Was the experiment population defined correctly?
Identify the eligible population before interpreting results.
Confirm whether randomization occurred at the user, account, store, or another level.
2. Did the allocation match the intended design?
Compare observed group counts with the configured probabilities.
Use an appropriate statistical diagnostic.
Investigate meaningful unexpected differences.
3. Were assignments stable?
Confirm that experimental units did not unintentionally switch between variants.
Review identity changes and assignment records.
4. Were exposure events recorded consistently?
Determine whether treatment and control experiences were logged using comparable rules.
Investigate missing or differential tracking.
5. Were users excluded after assignment?
Review all inclusion and exclusion criteria.
Determine whether post-treatment behavior affected who entered the analytical dataset.
6. Were outcomes measured consistently?
Use the same outcome definition, observation window, and appropriate analysis rules across groups.
Check whether treatment could affect measurement itself.
7. Was the statistical analysis appropriate?
Consider:
Sample size.
Randomization unit.
Outcome distribution.
Confidence intervals.
Multiple comparisons.
Repeated monitoring.
Statistical power.
Practical business significance.
8. Does the result justify the decision?
A positive conversion lift does not automatically justify a rollout.
Management should consider implementation costs, customer experience, operational constraints, uncertainty, and possible unintended effects.
The final decision should reflect both statistical and business evidence.
The Business Cost of Trusting a Broken Experiment
Suppose the company in the hypothetical example launches the redesigned checkout.
Management expects a 20% relative improvement in conversion rate.
But imagine the observed difference was partly caused by a tracking or selection problem.
The actual incremental effect might be smaller, zero, or even negative.
Without a valid experiment, the company cannot determine which interpretation is correct from the reported comparison alone.
This creates decision risk.
The company may spend money implementing a change that does not improve performance.
It may abandon a genuinely beneficial alternative.
It may incorrectly update its forecasts or customer acquisition assumptions.
The financial consequences depend on the scale and nature of the decision.
An SRM diagnostic does not quantify those consequences.
But it can prevent decision-makers from treating questionable experimental results as established causal evidence.
Better Experimentation Starts Before the Results Dashboard
Experimentation is often presented as a simple process:
Create two versions.
Split traffic.
Measure conversions.
Choose the winner.
A credible experimentation system requires more discipline.
It needs trustworthy randomization, stable identities, consistent exposure logging, appropriate outcome definitions, and transparent statistical analysis.
Sample Ratio Mismatch is one of the most useful early warning signals that something may be wrong with that process.
Its value is not that it explains every problem.
Its value is that it prompts investigation before a potentially misleading result becomes a business decision.
For the hypothetical checkout test, the observed conversion rates were 10% and 12%.
That difference is real within the recorded dataset.
But the unexpected allocation imbalance means the analyst should investigate before interpreting the 20% relative lift as a causal effect.
The right question is not simply:
"Which version won?"
It is:
"Was the experiment implemented and measured well enough for us to trust the result?"
That is where reliable experimentation begins.
References and Further Reading
- Fabijan, A., et al. (2019). Diagnosing Sample Ratio Mismatch in Online Controlled Experiments: A Taxonomy and Rules of Thumb for Practitioners. ACM SIGKDD International Conference on Knowledge Discovery & Data Mining. Microsoft Research.
- Microsoft Research. (2020). Diagnosing Sample Ratio Mismatch in A/B Testing.
- Statsig Documentation. SRM Checks.
- Statsig Documentation. Managing Sample Ratio Mismatch.
Need More Reliable Marketing Measurement?
UAD Consulting helps organizations connect marketing activity, customer behavior, measurement systems, and business decisions.
Projects can involve GA4 and GTM measurement, conversion tracking, campaign performance analysis, attribution questions, and evaluation frameworks.
The objective is to understand what the available evidence supports before using it to guide investment or operational decisions.
Explore our Marketing & Digital Analytics services to learn more about measurement and analytical support.
Contact UAD Consulting to discuss your analytics and experimentation requirements.
Explore ServicesGet in Touch