A company launches a new customer retention program.
Three months later, customer retention has improved.
Management concludes that the program worked.
But did it?
Perhaps retention improved because of the program. Perhaps customer demand changed, seasonality shifted, a competitor raised prices, or the company attracted a different mix of customers.
The improvement is real. Its cause remains uncertain.
This distinction matters whenever organizations evaluate marketing campaigns, pricing changes, operational improvements, new technologies, customer experience initiatives, or healthcare programs.
Businesses frequently make changes without designing a randomized experiment in advance.
That does not mean the impact cannot be investigated.
It means the analytical approach must account for a fundamental problem: we cannot directly observe what would have happened to the same business, at the same time, without the change.
This missing alternative is called the counterfactual.
One useful method for estimating it is difference-in-differences.
The Short Answer: Before-and-After Comparisons Are Often Not Enough
Suppose a retailer introduces a new sales training program.
Average weekly sales increase from $200,000 to $260,000.
The observed increase is:
A conventional performance dashboard might report a 30% increase and attribute the improvement to training.
But what if comparable stores that did not receive the training also experienced higher sales?
Perhaps demand increased across the entire market.
The relevant question is not simply:
"How much did performance change?"
It is:
"How much did performance change beyond what would likely have happened without the intervention?"
That is the question difference-in-differences attempts to answer.
What Is Difference-in-Differences?
Difference-in-differences, often abbreviated DiD, is a quasi-experimental method used to estimate the effect of an intervention by comparing outcome changes across two groups.
The basic design includes:
- A treatment group exposed to the intervention.
- A comparison group not exposed to the intervention.
- A period before the intervention.
- A period after the intervention.
Rather than comparing outcomes at one point in time, DiD compares changes over time.
The basic calculation is:
The first difference measures the observed change in the treatment group.
The second difference measures the observed change in the comparison group.
Subtracting the second from the first removes the change shared by both groups.
Under appropriate assumptions, the remaining difference can estimate the average treatment effect for the treated group.
However, the method does not automatically establish causality merely because two groups and two periods are available.
Its validity depends on the research design.
A Worked Example: Did Sales Training Increase Store Performance?
Consider a hypothetical retail company operating 40 stores.
Management introduces a sales training program at 20 stores.
The remaining 20 stores continue their existing operations.
For simplicity, assume:
- The groups contain 20 stores each.
- All stores remain open throughout the evaluation.
- Outcomes are measured consistently.
- The intervention begins between the two periods.
- There are no major spillovers between groups.
- The values represent average weekly sales per store.
The company observes:
| Group | Before Training | After Training | Change |
|---|---|---|---|
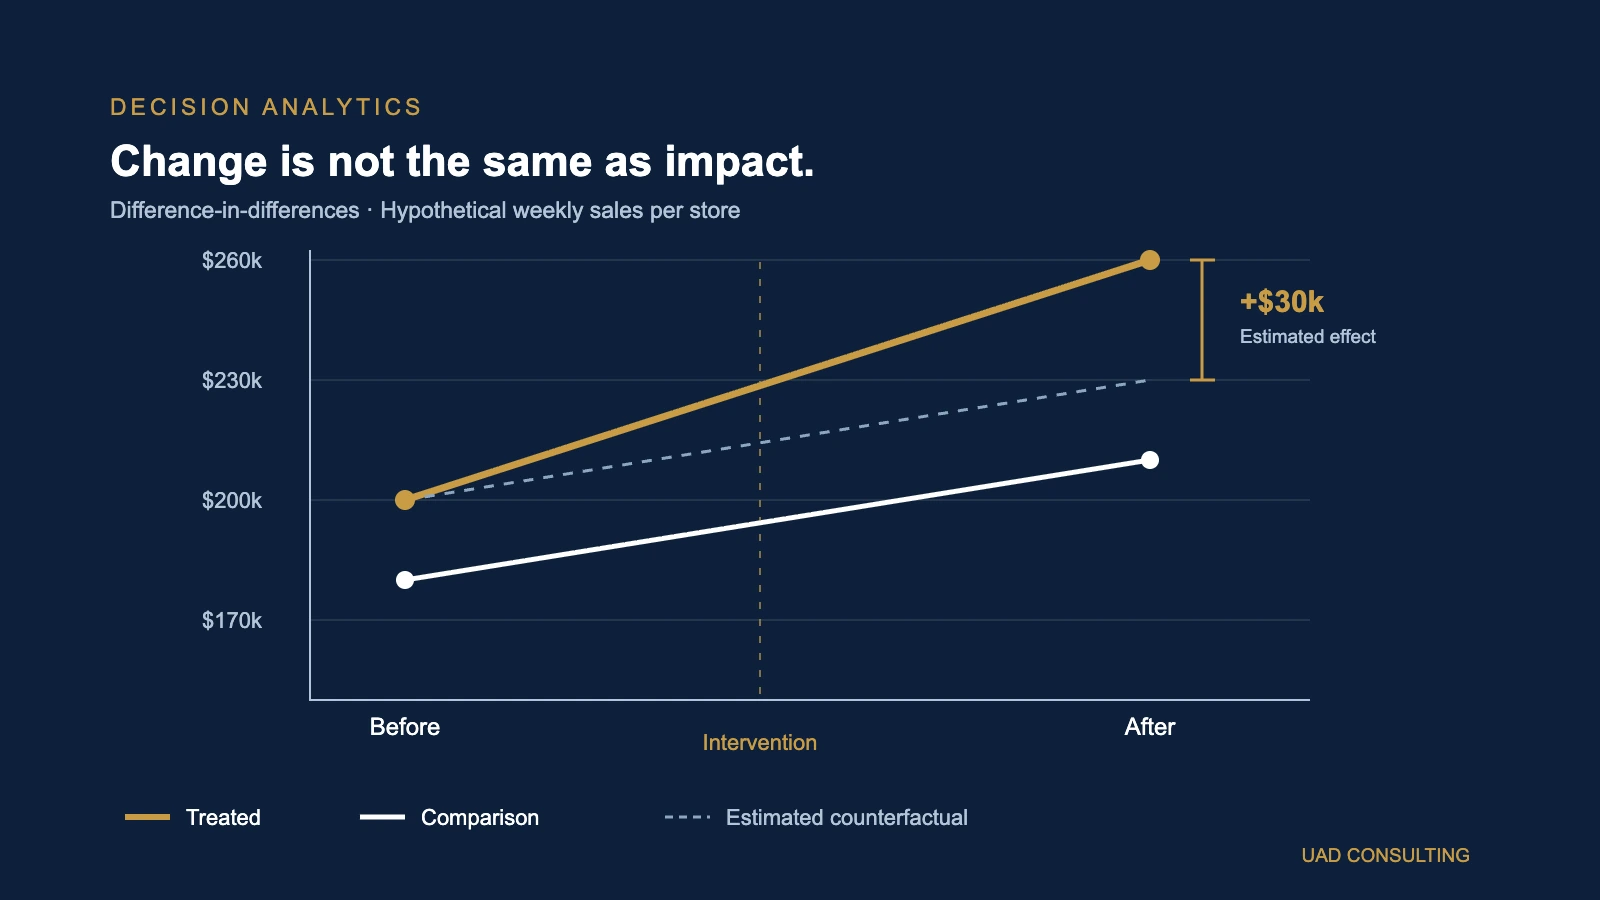
| Training stores | $200,000 | $260,000 | +$60,000 |
| Comparison stores | $180,000 | $210,000 | +$30,000 |
The training stores improved by $60,000.
But comparison stores improved by $30,000 without receiving the training.
The difference-in-differences estimate is:
The estimated incremental increase is therefore $30,000 in average weekly sales per treated store.
This is different from the observed $60,000 increase.
The comparison group suggests that some of the observed improvement may have occurred even without training.
Constructing the counterfactual
Under the identifying assumptions, the treated stores would have experienced the same $30,000 average increase as the comparison stores without the program.
Their estimated counterfactual post-training sales are:
Actual post-training sales were $260,000.
Estimated incremental effect:
The comparison group provides the basis for the counterfactual estimate.
It does not directly reveal the counterfactual as an observed fact.
Translating the estimate into business value
Suppose the company operates 20 treated stores.
Under the same assumptions, the estimated aggregate incremental weekly sales are:
If the incremental contribution margin is 35%, the estimated incremental weekly contribution becomes:
This is an illustrative economic translation, not an empirical finding.
The calculation assumes that the estimated effect applies across the treated stores and that the incremental contribution margin is appropriate.
Implementation costs, uncertainty, capacity constraints, and the duration of the effect must also be considered.
The example demonstrates how an analytical estimate can be connected to a business decision.
It does not establish that a real training program would produce these results.
The Most Important Assumption: Parallel Trends
Difference-in-differences depends critically on the parallel trends assumption.
In its basic form, this means that without the intervention, the treatment and comparison groups would have experienced the same average change in the outcome.
Notice what this does not require.
The groups do not need identical starting levels.
A group averaging $200,000 in sales can be compared with a group averaging $180,000.
Different baseline levels are not automatically a problem.
The more important question is whether their underlying outcome trends would have evolved similarly without treatment.
Why parallel trends matters
Imagine the training stores were already growing faster than the comparison stores before training.
Perhaps they were located in rapidly expanding neighborhoods.
If those differences continued, the treated stores might outperform the comparison stores even without the intervention.
A DiD estimate could mistakenly attribute some preexisting growth advantage to training.
The calculation would still be mathematically correct.
The causal interpretation would be questionable.
Can parallel trends be tested?
Historical data can help assess whether the groups followed similar trends before treatment.
For example, analysts can compare weekly sales across several pre-intervention months.
They can visualize the series and estimate pre-intervention differences in trends.
But an important limitation remains:
The parallel trends assumption concerns what would have happened after treatment in the absence of treatment.
That counterfactual cannot be directly observed.
Similar historical trends can support the plausibility of the assumption, but cannot prove it.
Likewise, a statistically insignificant pretrend test does not prove that parallel trends holds.
Pretrend tests may have limited statistical power.
Researchers should combine statistical diagnostics with substantive knowledge about how the groups were selected and how their environments differ.
Five Questions to Ask Before Trusting a DiD Estimate
1. Why did one group receive the intervention?
Treatment assignment matters.
Suppose management selected the fastest-growing stores for training.
Those stores may already differ systematically from the comparison group.
Alternatively, suppose training was introduced first at underperforming locations.
Their subsequent improvement could partly reflect regression to the mean.
Understanding the selection process is essential.
A credible evaluation should document who selected the treated units, when the decision was made, and which characteristics influenced selection.
2. Were other important changes introduced simultaneously?
Suppose the treated stores received training and a new promotional campaign at the same time.
If the comparison stores received neither, the DiD estimate may capture the combined impact of both interventions.
The design cannot automatically isolate the training effect.
Concurrent changes in pricing, staffing, inventory availability, technology, or management can create similar problems.
3. Could the treatment affect the comparison group?
Spillovers can undermine the design.
For example, customers might shift purchases from untreated stores to treated stores.
The treated stores would gain sales while comparison stores would lose sales.
The resulting difference could overstate the intervention's net effect on the company.
Alternatively, employees might share training materials across locations.
Then the comparison group would no longer be fully untreated.
The appropriate comparison group must be selected with these possibilities in mind.
4. Did the composition of the groups change?
Suppose poorly performing stores closed after the intervention.
Average sales among surviving stores might rise even if the intervention had little effect.
Similarly, customer cohorts, hospital populations, or geographic markets may change composition.
Analysts should examine attrition, missing data, unit definitions, and sample stability.
5. Is the measurement process consistent?
An apparent improvement may come from a change in measurement rather than business performance.
A CRM update might redefine a qualified lead.
A website release might change conversion tracking.
A hospital might revise coding procedures.
A retailer might change how refunds are recorded.
If the outcome is measured differently across groups or periods, the estimate may be distorted.
Reliable causal analysis requires reliable measurement.
For related discussion, see UAD Consulting's article:
"Before You Trust the Dashboard: Data Quality Checks Every Analytics Pipeline Needs."
A Simple Regression Representation
The basic two-group, two-period DiD model can be expressed as:
Where:
Y_it: Outcome for unit i at time t.
Treated_i: Indicator equal to 1 for units assigned to the treatment group.
Post_t: Indicator equal to 1 after the intervention.
Treated_i x Post_t: Interaction identifying observations in the treated group after the intervention.
delta: The difference-in-differences coefficient.
In the simple two-group, two-period model, delta corresponds to the difference between the two observed changes.
Under the relevant identifying assumptions, it can be interpreted as an average treatment effect on the treated group.
This regression does not make the design causal by itself.
Causal interpretation comes from the identification strategy and assumptions, not from the presence of an interaction term.
What about additional variables?
Analysts may include relevant pre-treatment characteristics to improve comparability or precision.
However, controlling for variables that were themselves affected by treatment can introduce bias.
Covariate selection should therefore follow a clear causal rationale.
More controls do not automatically mean a better causal estimate.
Statistical Uncertainty Still Matters
A DiD estimate of $30,000 does not establish that the true effect is exactly $30,000.
The estimate is subject to sampling uncertainty and potentially substantial design uncertainty.
A proper analysis should report:
- The estimated treatment effect.
- A confidence interval or other appropriate uncertainty measure.
- The number of independent treatment and comparison units.
- The observation period.
- The unit of analysis.
- The identifying assumptions.
- Important sensitivity analyses.
Repeated observations from the same store, hospital, customer, or geographic area may be correlated over time.
Treating every repeated observation as independent can understate uncertainty.
Appropriate clustering or other inference methods should reflect the treatment assignment and dependence structure.
Bertrand, Duflo, and Mullainathan (2004) demonstrate why serial correlation can produce misleading statistical significance in difference-in-differences studies.
The correct inference procedure depends on the design and the number of independent clusters.
With very few treated or comparison clusters, conventional large-sample cluster-robust approximations may be unreliable.
Why Multiple Treatment Dates Require More Care
The basic example assumes every treated store receives training at the same time.
Real businesses often roll out changes gradually.
One region may receive a new system in January, another in March, and another in June.
This creates a staggered adoption design.
A conventional two-way fixed-effects regression can behave poorly when treatment effects vary across groups or over time.
Some comparisons may implicitly use already-treated groups as controls.
Under treatment-effect heterogeneity, the resulting coefficient may not represent the intuitive average effect management expects.
Modern difference-in-differences methods address these issues by estimating group-time treatment effects and aggregating them more carefully.
Callaway and Sant'Anna (2021) provide one influential framework for settings with multiple periods and different treatment adoption dates.
For a staggered rollout, analysts should not automatically apply the simplest two-period formula to the entire dataset.
The estimation strategy must reflect the actual treatment timing.
When Difference-in-Differences Is Useful
The method can support a wide range of business and policy evaluations.
Marketing analytics
A company launches a regional advertising campaign in selected markets.
Comparable untreated markets may help estimate how sales changed beyond market-wide movements.
However, market selection, advertising spillovers, seasonality, and concurrent campaigns must be considered.
Observed attribution is not the same as causal incrementality.
For a broader explanation, see:
"Marketing Attribution vs. Incrementality"
Operations analytics
A company introduces a new scheduling system at selected facilities.
Analysts compare changes in throughput, waiting time, overtime, or service quality with facilities that did not adopt the system.
The design should account for differences in demand, staffing, and operational conditions.
Healthcare analytics
A hospital network introduces a new administrative workflow at selected facilities.
Analysts may compare changes in utilization, operational costs, or process outcomes with comparable facilities.
Differences in patient case mix, coding practices, treatment policies, and population composition require particular attention.
An observational estimate should not be interpreted as proof of improved clinical outcomes without an appropriate research design.
Digital product analytics
A company launches a new feature in selected markets or customer groups.
DiD may help evaluate changes in retention, engagement, or purchasing behavior when randomized assignment was unavailable.
However, user selection, network effects, and changes in tracking can threaten validity.
Difference-in-Differences vs. A/B Testing
Both approaches can support causal questions, but their identifying logic is different.
| Dimension | Randomized A/B Test | Difference-in-Differences |
|---|---|---|
| Assignment | Randomized | Usually nonrandomized |
| Comparison | Randomly assigned control | Observational comparison group |
| Main advantage | Randomization supports comparability | Can evaluate some nonrandomized changes |
| Main challenge | Compliance, interference, power, execution | Parallel trends and confounding |
| Typical application | Planned experiments | Retrospective or staged evaluations |
| Causal interpretation | Depends on valid design and execution | Depends on stronger observational assumptions |
A randomized experiment is often preferable when it is feasible, ethical, and properly designed.
But randomization is not always possible.
A company may have already launched a change.
A policy may apply to an entire region.
A hospital may be unable to randomize an operational intervention.
In those situations, quasi-experimental methods can provide useful evidence.
The method should be chosen based on the intervention, available data, assignment mechanism, and decision.
What If There Is No Suitable Comparison Group?
Difference-in-differences is not appropriate for every evaluation.
Sometimes there is no credible untreated comparison group.
Alternative approaches may include:
Interrupted time-series analysis
Examine whether an outcome's level or trend changed around an intervention, while modeling the preexisting time trend and other relevant factors.
This approach still requires assumptions about what would have happened without the intervention.
Synthetic control methods
Construct a weighted combination of untreated units designed to approximate the treated unit's pre-intervention outcome trajectory.
This can be useful when evaluating a major intervention affecting one region, organization, or market.
Its credibility depends on the available donor pool, pre-treatment fit, intervention timing, and other assumptions.
Randomized geographic experiments
When feasible, randomize the intervention across sufficiently independent geographic units.
This can provide a stronger design than selecting markets based only on convenience or historical performance.
Scenario analysis
When causal identification is not credible, decision-makers can still evaluate plausible scenarios.
But scenario analysis should not be presented as a causal estimate.
Sometimes the most defensible conclusion is that available data do not establish the intervention's incremental effect.
That conclusion is analytically useful.
A Practical Evaluation Workflow
Before evaluating a business intervention, use the following sequence.
Step 1: Define the intervention
Specify what changed, where it changed, when it changed, and who was exposed.
Avoid vague descriptions such as "we improved marketing."
Define the actual treatment.
Step 2: Define the outcome
Select a metric connected to the business decision.
Examples include incremental sales, contribution margin, customer retention, operational throughput, or cost per case.
Document how the metric is calculated.
Step 3: Identify candidate comparison units
Find units that were not exposed to the intervention.
Evaluate their historical outcomes, business characteristics, and exposure to common external factors.
Step 4: Examine pre-intervention behavior
Plot outcome trends before treatment.
Investigate major divergences, unusual events, structural changes, and measurement inconsistencies.
Use statistical diagnostics as supporting evidence rather than proof of parallel trends.
Step 5: Estimate the effect
Select an estimator appropriate for the treatment timing and data structure.
Report the estimated effect, uncertainty, sample size, and identifying assumptions.
Step 6: Perform sensitivity checks
Depending on the design, useful checks may include:
- Alternative comparison groups.
- Alternative pre-treatment periods.
- Placebo intervention dates.
- Negative-control outcomes.
- Different outcome definitions.
- Investigation of concurrent changes.
- Assessment of spillovers.
- Alternative inference procedures.
Passing these checks increases confidence but does not guarantee causal identification.
Step 7: Translate the result into a decision
Connect the estimated effect to costs, implementation requirements, uncertainty, and business constraints.
A positive effect does not automatically justify expansion.
Management may need to consider the cost of scaling, operational capacity, durability of the effect, and the consequences of being wrong.
What Should an Executive Impact Report Show?
A useful evaluation report should distinguish observed performance from estimated incremental impact.
For example:
| Reporting Element | Illustrative Result |
|---|---|
| Intervention | Sales training |
| Treated units | 20 stores |
| Comparison units | 20 stores |
| Observed treated change | +$60,000 per store per week |
| Comparison-group change | +$30,000 per store per week |
| DiD estimate | +$30,000 per treated store per week |
| Statistical uncertainty | Must be estimated from unit-level data |
| Main assumption | Parallel trends without treatment |
| Important risks | Selection, spillovers, concurrent changes |
| Business decision | Evaluate expansion after validation |
This report communicates more than a before-and-after dashboard.
It distinguishes what was observed, what was estimated, and what must be assumed for a causal interpretation.
That distinction is especially important when the result will influence significant investments.
The Real Question Is What Would Have Happened Otherwise
Businesses naturally evaluate initiatives by looking at what changed afterward.
But change is not the same as impact.
Sales can rise without a campaign being effective.
Customer retention can improve without a new retention program being responsible.
Hospital costs can decline without a new workflow causing the entire reduction.
A credible impact evaluation asks what would likely have happened without the intervention.
Difference-in-differences provides one way to investigate that question when a suitable comparison group and defensible assumptions are available.
The objective is not to manufacture certainty from observational data.
It is to make the counterfactual reasoning explicit, quantify uncertainty, test plausible alternative explanations, and help decision-makers distinguish measured improvement from estimated incremental impact.
A useful analytical conclusion does not merely say:
"Performance increased after the change."
It explains how much of that increase can credibly be attributed to the change, under which assumptions, and with what uncertainty.
That is the difference between performance reporting and impact evaluation.
References and Further Reading
- Callaway, B., & Sant'Anna, P. H. C. (2021). Difference-in-Differences with Multiple Time Periods. Journal of Econometrics, 225(2), 200-230. https://doi.org/10.1016/j.jeconom.2020.12.001
- Bertrand, M., Duflo, E., & Mullainathan, S. (2004). How Much Should We Trust Differences-in-Differences Estimates? Quarterly Journal of Economics, 119(1), 249-275. https://doi.org/10.1162/003355304772839588
- Marcus, M., & Sant'Anna, P. H. C. (2021). The Role of Parallel Trends in Event Study Settings: An Application to Environmental Economics. Journal of the Association of Environmental and Resource Economists, 8(2). https://doi.org/10.1086/711509
Need to Evaluate the Impact of a Business Change?
UAD Consulting helps organizations connect business questions with appropriate analytical methods, measurement frameworks, and decision-focused reporting.
Whether the question concerns marketing performance, operational improvements, or another business intervention, the starting point is understanding the available data and what the evidence can support.
Explore our Marketing & Digital Analytics services →
Or contact UAD Consulting to discuss an analytical question and the appropriate evaluation approach.
Explore ServicesGet in Touch