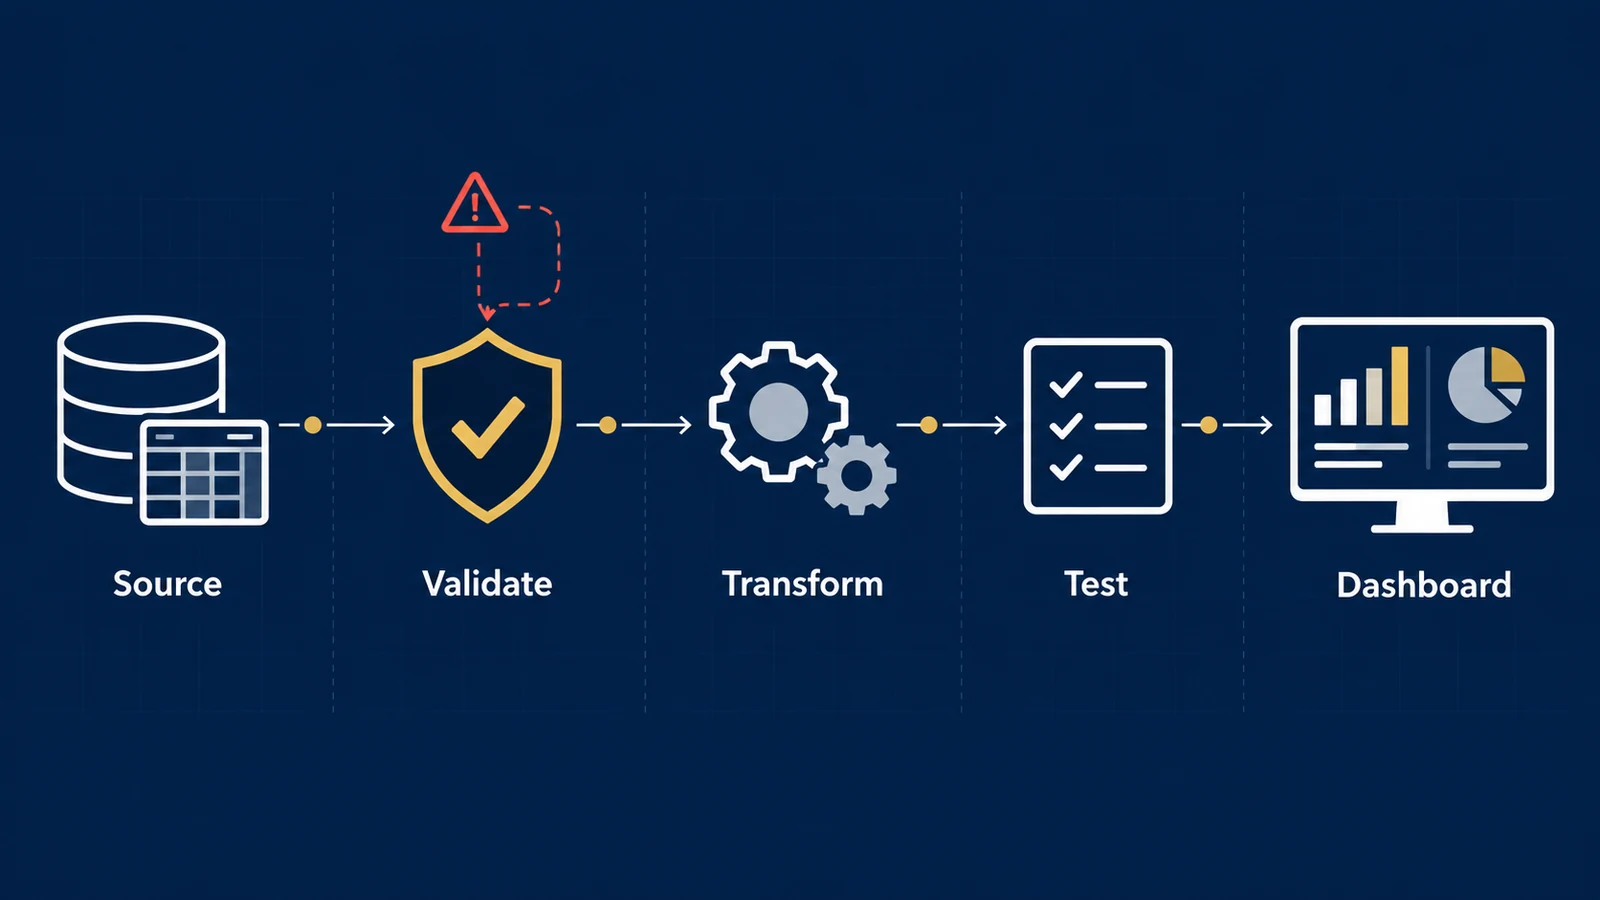
A dashboard can be beautifully designed, refresh every morning, and still be wrong.
The problem may have nothing to do with the visualization itself.
A source table may have loaded only 80% of yesterday’s transactions. A join may have duplicated orders. A tracking change may have started sending null campaign values. A timestamp field may be stale. Two systems may define “revenue” differently.
The dashboard can faithfully visualize every one of those problems. That is why data visualization should be treated as the presentation layer of a validated analytical system, not as a substitute for pipeline checks.
That is why analytics quality should not begin at the chart. It should begin in the pipeline that produces the numbers.
A practical data-quality framework asks a simple question:
“What must be true about this dataset before someone should use it to make a decision?”
The answer can often be translated into explicit, testable rules.
Data Quality Is Not One Thing
Calling a dataset “clean” is usually too vague to be useful.
Different failures require different tests.
A practical analytics pipeline can evaluate at least six dimensions.
| Dimension | Question | Example failure |
|---|---|---|
| Completeness | Are required values present? | 18% of orders have no customer ID |
| Uniqueness | Are records duplicated where they should be unique? | One order ID appears three times |
| Validity | Do values satisfy allowed formats and ranges? | Discount rate = 140% |
| Freshness | Is the data recent enough for its intended decision? | Daily dashboard is using data from three days ago |
| Consistency | Do related systems or fields agree? | Finance revenue differs materially from analytics revenue |
| Accuracy | Does the value represent reality correctly? | A valid ZIP code is assigned to the wrong customer |
These distinctions matter because a dataset can pass one dimension and fail another.
A revenue field may be 100% complete but systematically wrong. An order table may contain valid values but duplicate transactions. A dataset can be accurate when loaded yet too stale for today’s operational decision.
Google Cloud’s data-quality framework similarly separates freshness, volume, completeness, validity, consistency, accuracy, and uniqueness rather than reducing quality to a single concept.
Start With the Decision, Not With Hundreds of Tests
It is possible to create hundreds of automated checks and still fail to protect the numbers that matter.
The better starting point is the business decision.
Suppose leadership uses an e-commerce dashboard every morning to decide whether to increase or reduce advertising spend. A clear KPI framework helps make the measures and decision rules behind that dashboard explicit.
The dashboard reports:
- revenue;
- orders;
- advertising spend;
- conversion rate;
- average order value;
- return on ad spend.
Now ask:
“Which data failures could materially change that decision?”
That question creates a much more useful testing strategy.
For example, if yesterday’s transaction load is incomplete, reported revenue and orders may be understated. If orders are duplicated after a join, revenue may be overstated. If advertising spend has not refreshed, ROAS may be inflated. If the definition of conversion changes, the trend may no longer be comparable.
The priority is therefore not “test every column equally.”
It is:
“Protect the data dependencies of important decisions.”
Five Checks That Can Protect a Dashboard
Consider a simplified warehouse table:
analytics.orders
with these fields:
order_idcustomer_idorder_timestamprevenuechannel
Suppose the table feeds an executive sales dashboard.
1. Completeness Check
If every completed order should have an ID and revenue value, missing records should be detected before aggregation.
SELECT
    COUNT(*) AS total_rows,
    SUM(CASE WHEN order_id IS NULL THEN 1 ELSE 0 END) AS missing_order_ids,
    SUM(CASE WHEN revenue IS NULL THEN 1 ELSE 0 END) AS missing_revenue
FROM analytics.orders
WHERE DATE(order_timestamp) = CURRENT_DATE - INTERVAL '1 day';
The test itself is easy.
The harder question is the threshold.
Should one missing revenue value fail the pipeline?
Sometimes yes. Sometimes no.
A regulatory or financial reconciliation process may require effectively complete records, while a behavioral analytics dataset may tolerate a small amount of missing optional information.
The quality threshold should therefore reflect the use of the data, not an arbitrary desire for 100% on every field.
2. Uniqueness Check
Suppose order_id is expected to identify exactly one order.
SELECT
    order_id,
    COUNT(*) AS row_count
FROM analytics.orders
GROUP BY order_id
HAVING COUNT(*) > 1;
Ideally, this query returns zero rows.
Why does this matter?
Imagine the source contains:
| order_id | revenue |
|---|---|
| A101 | $120 |
| A102 | $80 |
| A103 | $200 |
True revenue is:
$120 + $80 + $200 = $400
Now suppose an incorrect one-to-many join duplicates A103:
| order_id | revenue |
|---|---|
| A101 | $120 |
| A102 | $80 |
| A103 | $200 |
| A103 | $200 |
The dashboard reports:
$600
Nothing is wrong with the SUM(revenue) calculation.
The analytical error occurred before the metric was calculated.
Reported revenue is now 50% above the true $400 value simply because one $200 order was duplicated.
3. Validity Check
Some values can be present and unique but impossible.
Suppose revenue should never be negative in this particular finalized-order table.
SELECT *
FROM analytics.orders
WHERE revenue < 0;
Or perhaps channel is restricted to an approved taxonomy:
SELECT DISTINCT channel
FROM analytics.orders
WHERE channel NOT IN (
    'paid_search',
    'paid_social',
    'organic_search',
    'email',
    'direct',
    'referral'
);
These tests convert business definitions into executable rules.
Google Cloud’s data-quality documentation gives comparable examples: range expectations, non-null rules, allowed-value sets, uniqueness expectations, and SQL assertions can all be evaluated as explicit quality rules.
The key idea is broader than any particular platform:
“If a business rule can be expressed precisely, it can often be tested before the data reaches the dashboard.”
4. Freshness Check
A dashboard can show perfectly valid historical data and still be operationally misleading.
Suppose an executive dashboard is expected to contain data through yesterday.
A basic freshness test might be:
SELECT
    MAX(order_timestamp) AS latest_order_timestamp
FROM analytics.orders;
The pipeline can compare that result with its expected refresh window.
The appropriate threshold depends on the decision.
A monthly strategic report may tolerate data that is several days old.
A daily inventory decision may not.
A near-real-time fraud system may require freshness measured in minutes or seconds.
So “fresh” does not mean the same thing for every dataset.
It means:
“Recent enough for the decision the data is expected to support.”
5. Reconciliation Check
Row-level tests are valuable, but some of the most important checks happen at the aggregate level.
Suppose the analytics warehouse reports yesterday’s revenue as $248,400, while the validated commerce source reports $250,000.
The absolute difference is:
$250,000 − $248,400 = $1,600
The relative difference is:
$1,600 / $250,000 = 0.64%
Whether 0.64% is acceptable depends on why the difference exists and what the metric is used for.
For one operational dashboard, a documented timing difference might make that variance acceptable.
For a financial close process, it might not be.
A reconciliation test could calculate:
SELECT
    warehouse_revenue,
    source_revenue,
    warehouse_revenue - source_revenue AS difference,
    ABS(warehouse_revenue - source_revenue)
        / NULLIF(source_revenue, 0) AS relative_difference
FROM revenue_reconciliation;
This type of check answers something column validation cannot:
“Does the analytical system agree with an appropriate reference point at the level that matters to the business?”
A Small Data-Quality Scorecard
The results can be summarized into a decision-oriented scorecard.
Imagine yesterday’s pipeline produced:
| Test | Result | Threshold | Status |
|---|---|---|---|
| Required order IDs present | 100.00% | 100% | Pass |
| Unique order IDs | 99.98% | 100% | Fail |
| Valid revenue values | 100.00% | 100% | Pass |
| Data freshness | 7:12 AM | Before 8:00 AM | Pass |
| Revenue reconciliation difference | 0.64% | ≤1.00% | Pass |
Four tests pass.
One fails.
Should the dashboard publish?
Counting four passes out of five and declaring “80% data quality” would be dangerous.
If the failed uniqueness test duplicates high-value orders, it could materially distort revenue even though most checks passed.
This illustrates why data-quality rules should have business severity, not just pass/fail counts.
A useful classification might be:
- Critical — failure blocks publication or decision use.
- Warning — publication can continue, but users should be alerted and the issue investigated.
- Informational — monitored for drift without affecting current use.
The order-ID uniqueness rule might be Critical. A small increase in an optional demographic field’s missingness might only be a Warning.
The severity depends on the decision the dataset supports.
Row Count Is Useful, but It Is Not Enough
A common pipeline test asks:
“Did roughly the expected number of rows arrive?”
That is useful.
If a table normally receives 100,000 daily transactions and suddenly receives 12,000, something is probably wrong.
But row count alone can miss serious failures.
A pipeline might receive exactly 100,000 rows while:
- customer IDs are null;
- yesterday’s data was loaded twice;
- revenue is in the wrong currency;
- channel taxonomy changed;
- timestamps shifted timezone;
- a join assigned transactions to the wrong campaigns.
Volume is therefore one signal, not proof of correctness.
Data Quality Should Exist at Multiple Layers
A reliable analytics architecture does not rely on one final test immediately before the dashboard.
Think of quality checks as layers:
- Source
- Ingestion
- Transformation
- Metric
- Dashboard
At the source layer, ask whether the expected records and fields exist.
At ingestion, verify volume, schema, timestamps, and load completion.
During transformation, test keys, joins, accepted values, nulls, and business rules.
At the metric layer, reconcile important aggregates and definitions.
At the dashboard layer, verify freshness, filters, and whether displayed metrics correspond to the intended semantic definitions.
This layered approach makes failures easier to isolate.
If executive revenue suddenly changes by 30%, the organization should be able to investigate whether the cause is:
- real business performance;
- a source-system change;
- a failed ingestion;
- transformation logic;
- metric-definition change;
- or presentation logic.
Without those layers, every unexpected number becomes a manual investigation.
Data-Quality Failures Are Not Automatically Evidence of Business Change
This distinction is especially important in marketing and digital analytics.
Suppose reported conversions fall 25% immediately after a website release.
That does not prove conversions actually fell 25%.
Possible explanations include:
- customer behavior changed;
- the conversion event stopped firing;
- consent behavior changed;
- the checkout flow changed;
- the analytics pipeline is delayed;
- campaign tagging changed;
- a reporting filter changed.
The observed reporting change is evidence that the measured value changed.
Determining whether the underlying business outcome changed requires additional validation.
The same principle applies to healthcare, operations, finance, and other analytical domains.
Correlation between a system change and a metric change does not establish that the system change caused the underlying business outcome.
Instrumentation and pipeline integrity should be checked before making that causal claim.
Who Should Own a Data-Quality Rule?
Technical teams can implement tests, but they should not have to invent every business threshold.
Consider:
revenue >= 0
Engineering can implement that rule.
But whether refunds belong in the same table, whether negative values are legitimate, which revenue definition should feed an executive KPI, and what reconciliation variance is acceptable are business-definition questions.
Effective ownership therefore often spans:
- Business owner — defines what the metric means and what level of error matters.
- Analytics/data team — translates that expectation into measurable rules.
- Engineering/platform layer — executes and monitors those rules reliably.
- Decision maker — understands whether the resulting data is fit for the intended use.
This separation reduces a common failure mode: technically valid data that does not represent the business concept stakeholders think they are using.
Data Quality Is Contextual, Not Absolute
There is no universal quality score that makes every dataset safe for every decision.
A customer-age field can be irrelevant to a daily revenue dashboard and essential to an age-specific analysis.
Five-minute latency may be excellent for one workflow and unusable for another.
A 0.5% reconciliation difference may be immaterial for exploratory marketing analysis and unacceptable for another application.
So the most useful question is not:
“Is our data high quality?”
It is:
“Is this data sufficiently reliable for this specific use and decision?”
That framing turns data quality from an abstract technical objective into a business requirement.
A Practical Pre-Dashboard Checklist
Before a decision-critical dataset reaches production reporting, ask:
- Completeness
Are the fields required for this decision populated? - Uniqueness
Are entities unique at the intended analytical grain? - Validity
Do values follow allowed ranges, types, formats, and categories? - Freshness
Has the dataset been updated within the required decision window? - Consistency
Do definitions and related values agree across the relevant systems? - Reconciliation
Do critical totals reasonably match an authoritative reference? - Transformation integrity
Could joins, filters, aggregations, or schema changes have altered the grain or meaning? - Business definition
Does the metric actually represent what stakeholders think it represents? - Severity
Which failures should block publication, and which should only trigger warnings? - Ownership
Who is responsible for investigating each failed rule?
If those questions have explicit answers, analytics becomes easier to trust, troubleshoot, and govern.
From Data Pipelines to Trustworthy Decisions
Data engineering is sometimes treated as infrastructure that sits behind the “real” analytics.
In practice, the distinction is artificial.
Every dashboard, statistical model, machine-learning prediction, marketing attribution report, healthcare analysis, or business decision inherits the limitations of the data pipeline feeding it.
Better charts cannot correct duplicated transactions.
More sophisticated models cannot recover information that was never captured.
AI cannot reliably reason from business definitions that were never made explicit.
The objective is therefore not perfect data.
It is a system in which important assumptions become visible, important failures become testable, and decision makers can understand whether the information in front of them is fit for its intended purpose.
That is what turns a pipeline from a mechanism for moving data into infrastructure for trustworthy analytics.
References
Can You Trust the Data Behind Your Dashboard?
UAD Consulting helps organizations connect data engineering, analytics, and business definitions so decision-critical reporting can be tested before stakeholders act on it.
Explore Services Get in Touch