Businesses rarely suffer from a shortage of metrics.
A digital team may monitor sessions, engagement rate, conversion rate, cost per acquisition, and return on ad spend. Finance may focus on revenue, margin, cash flow, and profitability. Operations may track cycle time, utilization, throughput, and service levels. Executives may receive a dashboard containing a selection from all three.
The result can be dozens—or hundreds—of numbers updated every day.
But having more metrics does not necessarily create better decisions.
A useful KPI system should answer a more demanding question:
“When this number changes, what decision should the organization make differently?”
That question separates a dashboard metric from a genuine key performance indicator.
A Metric Is Not Automatically a KPI
A metric is a quantitative measurement.
A KPI is a measurement considered important enough to evaluate progress toward a specific business objective.
The distinction sounds simple, but it changes how analytics should be designed.
Website sessions are a metric.
If an organization's strategic objective is profitable customer acquisition, sessions alone may not be a particularly useful KPI. An increase in traffic could come from low-intent visitors who generate no meaningful business value.
Conversion rate might provide additional information, but even conversion rate can be misleading when viewed alone.
A campaign could increase conversion rate while acquiring fewer total customers. Another campaign could produce a lower conversion rate but substantially more profitable customers.
The appropriate KPI depends on the decision being evaluated.
This is why KPI design should begin with business objectives rather than available columns in a dataset.
Start With the Decision, Not the Dashboard
A common analytics workflow begins by asking:
“What should we put on the dashboard?”
A better starting point is:
“What decisions does this team need to make?”
Consider a marketing director deciding how to allocate next month's acquisition budget.
The decision might depend on:
- incremental customers acquired
- customer acquisition cost
- expected customer value
- contribution margin
- available budget
- channel capacity
Page views may still be useful diagnostically, but they probably should not receive the same prominence as metrics directly connected to the allocation decision.
Now consider an operations manager responsible for reducing service delays.
Their KPI system might instead emphasize:
- processing time
- queue length
- capacity utilization
- service-level attainment
- rework rate
The data can come from the same organization while supporting entirely different decisions.
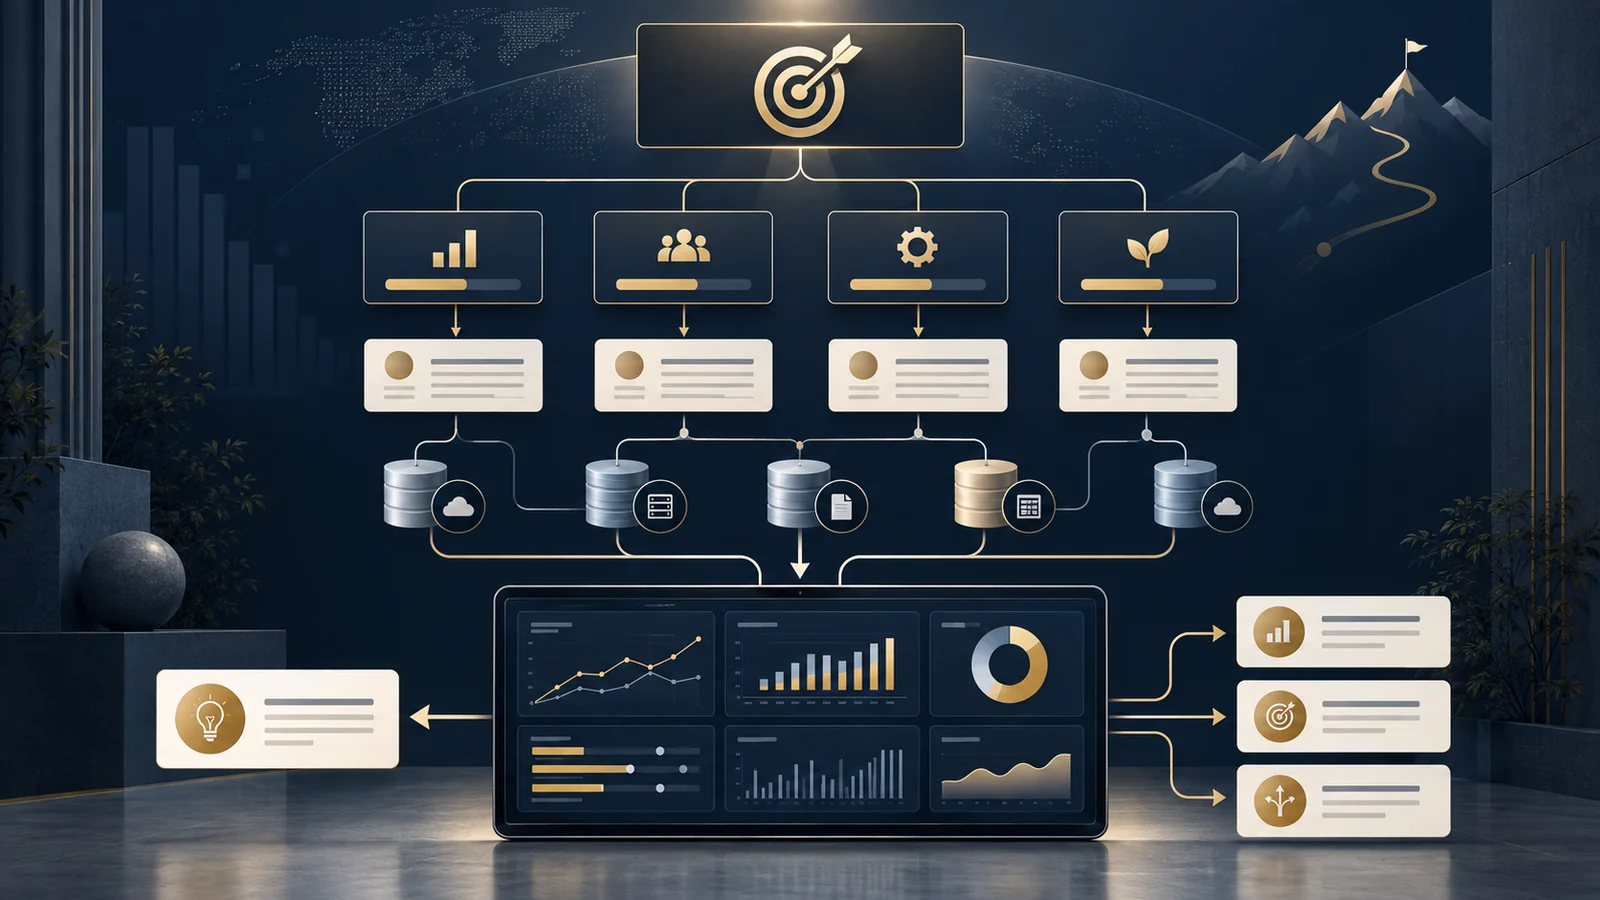
A good KPI framework therefore connects objective → decision → metric → action.
Every KPI Needs an Operational Definition
A KPI name is not enough.
Consider a company reporting “conversion rate.”
One analyst calculates:
Purchases / Sessions
Another calculates:
Customers Who Purchased / Users
A third calculates:
Orders / Qualified Leads
All three calculations could legitimately be called conversion rate.
If the dashboard displays only the label, disagreement is inevitable.
A KPI definition should specify at least:
| Component | Example |
|---|---|
| KPI | Customer Conversion Rate |
| Business purpose | Measure how effectively qualified leads become customers |
| Numerator | Unique qualified leads completing a first purchase |
| Denominator | Unique qualified leads eligible during the measurement period |
| Exclusions | Test accounts, employees, canceled transactions |
| Time basis | Calendar month, America/Chicago |
| Data source | CRM + transaction database |
| Owner | Growth Analytics |
| Reporting frequency | Weekly / monthly |
| Decision supported | Acquisition-channel and funnel optimization |
This may look like documentation.
In practice, it is part of the analytical model.
Without these definitions, two technically correct SQL queries can produce different answers to what appears to be the same question.
The KPI Tree Connects Strategy to Data
One useful technique is to create a KPI tree.
Suppose a subscription business wants to increase annual profit.
At a simplified level:
Profit = Revenue − Cost
Revenue might then be decomposed into:
Revenue = Active Customers × Average Revenue per Customer
Active customers could depend on:
Beginning Customers + New Customers − Churned Customers
New customers could depend on:
Qualified Traffic × Conversion Rate
Acquisition spending might influence qualified traffic, while retention initiatives influence churn.
The result is a hierarchy connecting a high-level business outcome to operational drivers.
This structure is more useful than placing unrelated KPIs next to one another because it gives analysts a framework for investigating why a result changed.
If profit declines, the organization can move down the tree.
Was revenue lower?
Were there fewer active customers?
Did acquisition slow?
Did churn increase?
Did average revenue change?
The KPI tree turns a dashboard into a diagnostic system.
A Worked Example: When Conversion Rate Improves but the Business Performs Worse
Suppose a company compares two months.
| Metric | Month A | Month B |
|---|---|---|
| Qualified visitors | 100,000 | 70,000 |
| Conversion rate | 4.0% | 5.0% |
| Customers acquired | 4,000 | 3,500 |
| Average contribution per customer | $80 | $75 |
| Acquisition contribution | $320,000 | $262,500 |
Month B appears better if management focuses only on conversion rate.
Conversion increased from 4% to 5%—a relative improvement of 25%.
But the organization acquired 500 fewer customers.
Contribution associated with those acquisitions declined from $320,000 to $262,500, assuming the stated contribution values and no other relevant differences.
The conversion-rate improvement is real.
The conclusion that business performance improved is not.
This example illustrates why KPI systems need both rates and volumes, and why operational metrics should ultimately connect to business outcomes.
Leading and Lagging Indicators Serve Different Purposes
Some KPIs describe outcomes that have already occurred.
Revenue, profit, churn, and completed sales are commonly lagging indicators.
Other measures may provide earlier information about what could happen next.
Qualified pipeline, product activation, appointment completion, or backlog levels can sometimes function as leading indicators.
Leading indicators are attractive because organizations want early warning.
But calling a metric “leading” does not prove that it reliably predicts a future outcome.
That relationship should be evaluated empirically.
For example, an organization might observe that product-demo completion is associated with higher customer retention.
That is useful evidence.
It does not automatically establish that forcing more users through demos will cause retention to increase.
The relationship may partly reflect differences in user motivation or customer type.
This is where KPI analysis connects with experimentation, predictive analytics, and causal measurement.
A KPI can identify where to investigate without proving why the pattern exists.
Targets Need Context
A KPI without a benchmark can be difficult to interpret.
Suppose customer acquisition cost is $85.
Is that good?
The number is almost meaningless without additional context.
Useful comparisons could include:
- historical performance
- budget target
- customer lifetime economics
- channel-specific benchmarks
- forecast
- control limits
- comparable customer segments
A company with $600 of expected contribution from an acquired customer may evaluate an $85 acquisition cost very differently from a company with $70 of expected contribution.
Targets should therefore reflect business economics rather than arbitrary preferences for numbers moving up or down.
Not Every KPI Should Be Maximized
Dashboards often implicitly suggest that higher is better.
Business systems are rarely that simple.
Inventory provides an obvious example.
Too little inventory can create stockouts and lost sales.
Too much inventory ties up capital and can increase storage costs or obsolescence.
The objective is not maximum inventory.
It is an appropriate level given demand, service requirements, lead times, uncertainty, and cost.
The same reasoning applies to marketing frequency, staffing utilization, hospital capacity, discount rates, and many other measures.
Some KPIs therefore need a target range rather than a maximum or minimum.
Analytics becomes more useful when it represents these trade-offs explicitly.
Segment Before You Average
Organization-wide averages can conceal important variation.
Suppose average customer acquisition cost is $90.
That number could represent:
- Paid Search: $55
- Paid Social: $80
- Affiliate: $95
- Display: $180
The overall KPI is useful for executive monitoring.
The segmented values are more useful for diagnosing performance.
The same principle applies across business analytics.
Average hospital cost may conceal differences by patient severity.
Average order value may vary dramatically between new and returning customers.
Average service time may hide one location with persistent delays.
A mature KPI framework often uses a hierarchy:
Enterprise KPI → Business Unit → Segment → Diagnostic Metric
Executives do not need every segment on the primary dashboard.
Analysts do need the ability to investigate them.
KPI Ownership Matters
When a KPI looks wrong, who is responsible for resolving the question?
Without ownership, metric problems can remain unresolved because the data team assumes the business team owns the definition while the business team assumes analytics owns the number.
A KPI owner does not necessarily need to maintain the database.
The owner should be accountable for the business meaning of the metric.
Analytics and data teams can then maintain its technical implementation.
This separation is useful:
Business owner: What does the KPI mean and why does it matter?
Data owner: Where does the underlying data come from?
Analytics owner: How is the KPI calculated and validated?
In a small organization, one person may perform several of these roles.
The conceptual distinction still helps.
Build a KPI Dictionary Before Building More Dashboards
As organizations accumulate reports, a KPI dictionary can become an important governance tool.
For each important metric, document:
- name
- business definition
- formula
- grain
- data source
- exclusions
- time zone
- refresh frequency
- owner
- target or benchmark
- related dimensions
- known limitations
This does not need to begin as an elaborate governance platform.
A carefully maintained table can already eliminate substantial ambiguity.
The important step is establishing one reference point for how critical metrics are defined.
This connects directly with data quality and semantic-layer design: reliable dashboards depend not only on clean records but also on consistent business meaning.
KPI Alerts Should Lead to Actions
Analytics platforms can generate alerts when metrics cross thresholds.
But an alert without an associated response often becomes noise.
Suppose a dashboard sends an alert whenever conversion rate falls below 3%.
What should happen next?
A useful decision rule might be:
- Validate tracking and data completeness.
- Compare the decline across traffic sources.
- Check whether traffic mix changed.
- Segment by device, geography, and customer type.
- Examine funnel-stage changes.
- Escalate only if the decline persists beyond expected variation.
Now the KPI is connected to an analytical workflow.
The organization is no longer simply observing the number.
It knows how the number should influence action.
Good KPI Systems Reduce, Rather Than Increase, Complexity
The goal of KPI design is not to capture every measurable activity.
It is to create a small, coherent system that helps people understand performance and investigate changes.
A strong executive dashboard may contain relatively few KPIs.
Each can then connect to deeper analytical layers.
For example:
Executive: Revenue growth
Management: Active customers, average revenue, churn
Operational: acquisition volume, conversion, retention, pricing
Diagnostic: campaign, channel, customer segment, product, geography
This layered structure preserves simplicity without discarding analytical depth.
From Reporting Metrics to Managing Decisions
The strongest KPI frameworks connect several layers:
Business objective → Decision → KPI → Definition → Data source → Target → Diagnostic analysis → Action
If one of those connections is missing, the metric becomes less useful.
A beautifully designed dashboard cannot compensate for an ambiguous KPI.
A sophisticated data warehouse cannot determine which outcome the business should optimize.
And a perfectly calculated metric provides little value if nobody knows what action should follow when it changes.
The purpose of KPI design is therefore not simply measurement.
It is to create a shared analytical language between strategy, data, and decision-making.
Before adding another metric to a dashboard, ask:
“What decision will become better because we measure this?”
If there is no clear answer, the metric may not belong on the dashboard at all.
Build a KPI System Around the Decisions That Matter
UAD Consulting helps organizations structure business questions, define meaningful performance measures, organize analytical data, and translate dashboards into clearer decision support.
Explore ServicesGet in Touch