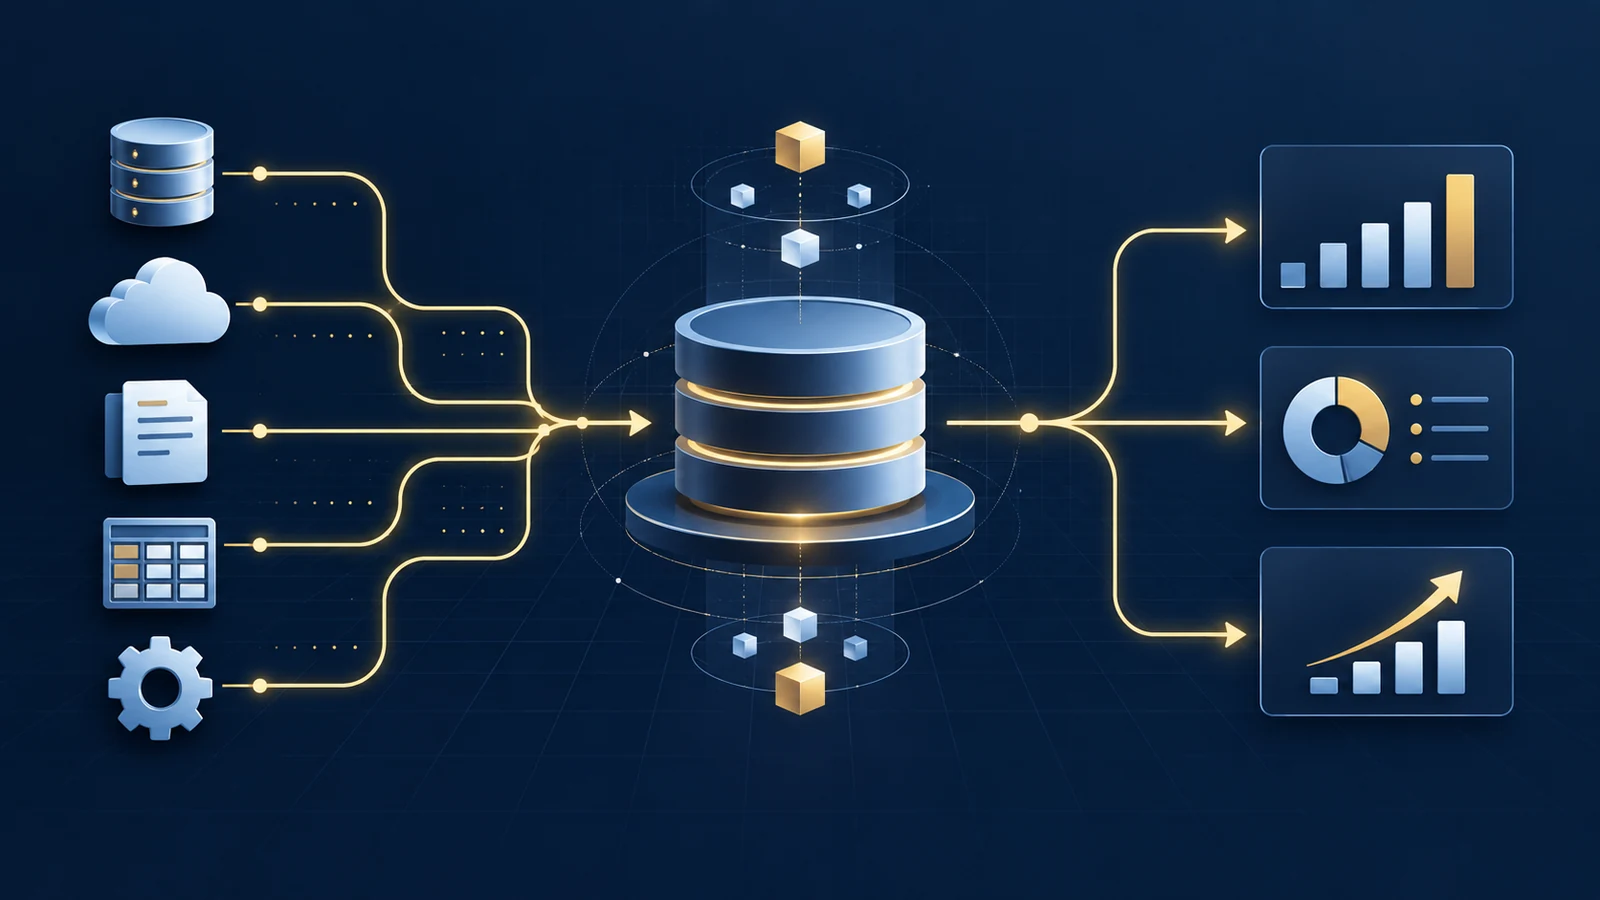
A company rarely wakes up one morning and suddenly “needs a data warehouse.”
The problem usually develops gradually. Sales has a CRM. Marketing has advertising platforms and web analytics. Finance has an accounting system. Operations has its own database. Someone maintains several Excel files. Management wants one dashboard showing revenue, customers, marketing performance, and operational KPIs.
At first, analysts solve the problem by exporting data and joining files. Then the exports become scheduled scripts. The scripts become pipelines. The dashboard becomes business-critical.
Eventually a question such as “What was customer acquisition cost by product and region last quarter?” requires data from four systems, several transformations, and a debate about which revenue number is correct.
At that point, the important question is not “Should we buy Snowflake, BigQuery, or another warehouse?” It is: “Has our analytical workload become different enough from our operational workload that it deserves its own data architecture?” That is the decision a data warehouse is designed to address.
Start With the Difference Between Running the Business and Analyzing It
Operational databases and analytical systems solve different problems. An operational system might need to:
- create an order;
- update a customer’s address;
- process a payment;
- check inventory;
- record an appointment.
These operations are usually narrow, frequent, and focused on the current state of individual records. Analytics asks different questions:
- How has revenue changed over 24 months?
- Which acquisition channels produce the highest-value customers?
- How does customer retention differ by cohort?
- Which locations consistently underperform?
- How do marketing spend, orders, and margins interact?
Those questions often require large scans, historical comparisons, aggregations, and joins across multiple business systems. A database can technically perform both types of work. The architectural question is whether it should.
A Data Warehouse Is More Than a Large Database
A data warehouse is often described simply as a central place where a company stores data. That description misses much of its value.
A useful analytical warehouse provides a controlled environment where data from multiple operational systems can be:
- Collected
- Standardized
- Integrated
- Historically preserved
- Modeled
- Queried
The important word is integrated. Putting five source tables in one location does not automatically create trustworthy analytics. If one system calls a customer customer_id, another uses an email address, and a third identifies the same person using an advertising identifier, the analytical problem still exists.
Likewise, “revenue” may mean booked revenue to Finance, gross transaction value to Sales, and purchase-event value to Marketing. The warehouse creates an opportunity to define those relationships deliberately.
Five Signals That a Warehouse May Be Justified
1. Multiple Systems Must Be Joined Repeatedly
Suppose management needs a weekly report combining CRM opportunities, advertising spend, GA4 acquisition data, transaction data, and refunds. If an analyst manually exports and combines those sources every week, the business already has an integration process. It is simply a manual one. The warehouse question becomes whether that repeated integration should be standardized and automated.
2. Historical State Matters
Operational systems often emphasize what is true now. Analytics frequently needs to know what was true then. If a customer is currently classified as Enterprise but was SMB when a transaction occurred 18 months ago, should historical reporting show the current segment or the segment at the time of the transaction? Historical modeling allows the organization to answer intentionally rather than accidentally overwriting the past.
3. Analytical Queries Are Becoming Complex
Consider: “Show monthly net revenue and 90-day repeat-purchase rate by original acquisition channel for customers whose first purchase occurred this year.” This requires identifying each customer’s first order, attaching acquisition information, calculating subsequent purchases, accounting for refunds, creating cohorts, and aggregating by month and channel. That is an analytical workload.
4. Different Teams Produce Different Answers
One of the strongest warehouse signals is not data volume. It is disagreement. Marketing says revenue was $4.8 million. Finance says $4.5 million. Sales says $5.1 million. The difference may come from refunds, taxes, booking versus payment dates, duplicate transactions, currency conversion, canceled orders, or attribution rules.
A warehouse will not magically decide which definition is correct. But a governed analytical model can make the definition explicit and reproducible.
5. Reporting Depends on Individual People
Ask: “If the analyst who maintains this dashboard leaves tomorrow, can someone else reproduce the number?” If the answer is no, the company may have a data architecture problem rather than merely a staffing problem. Critical transformations buried inside spreadsheets, analyst laptops, or undocumented dashboard calculations create organizational dependency.
A Simple Warehouse Readiness Score
A company can evaluate the decision systematically. Consider five dimensions scored from 0 to 4.
| Dimension | 0 | 2 | 4 |
|---|---|---|---|
| Data sources | One main source | Several sources | Many fragmented systems |
| Historical need | Current state sufficient | Some trend analysis | Historical state essential |
| Transformation complexity | Minimal | Repeated joins/cleaning | Multi-stage business logic |
| Reporting consistency | Metrics generally agree | Occasional disagreement | Frequent KPI disputes |
| Operational dependency | Ad hoc reporting | Important recurring reports | Business-critical analytics |
Suppose a company scores:
| Dimension | Score |
|---|---|
| Data sources | 4 |
| Historical need | 3 |
| Transformation complexity | 4 |
| Reporting consistency | 3 |
| Operational dependency | 4 |
| Total | 18 / 20 |
An 18 does not mathematically prove that the company should build a warehouse. This is a decision-support framework, not an industry standard. But it exposes why the current architecture is under pressure.
When You Probably Do Not Need a Warehouse Yet
Data engineering projects can easily become over-engineered. Suppose a small organization has one transactional database, a few thousand transactions per month, limited historical requirements, one analyst, and a small number of stable reports.
Its existing relational database may already answer its analytical questions adequately. Adding a warehouse could introduce infrastructure, pipeline maintenance, transformation logic, monitoring, access management, cloud cost, and additional failure points. Architecture should follow the problem. A simpler solution that reliably answers the business question is often better than a technically impressive platform that creates unnecessary operational burden.
A Worked Example: From Three Systems to One Analytical Model
Imagine an ecommerce company with three primary sources.
| customer_id | lead_source | created_at |
|---|---|---|
| 1042 | Google Ads | Jan 4 |
| 1043 | Organic | Jan 6 |
| order_id | customer_id | revenue | order_date |
|---|---|---|---|
| 8001 | 1042 | $220 | Jan 10 |
| 8002 | 1042 | $90 | Feb 3 |
| 8003 | 1043 | $150 | Jan 14 |
| date | channel | spend |
|---|---|---|
| Jan 4 | Google Ads | $800 |
| Jan 4 | Meta | $500 |
Leadership asks: “What revenue did each acquisition channel generate relative to marketing spend?” The tables cannot simply be added together. The business first needs decisions about how a customer is assigned to a channel, whether channel means first touch, last touch, or another rule, how refunds affect revenue, whether spend is daily or campaign-level, and what reporting period should be used.
A warehouse can centralize the data. But business logic creates the metric. Data engineering can make a calculation consistent; it cannot make an arbitrary attribution rule causal. If first-touch attribution assigns $310 of Customer 1042’s revenue to Google Ads, that means the selected attribution model credited Google Ads with that revenue. It does not prove Google Ads caused all $310.
The Analytical Layer Is Where Business Definitions Become Reusable
Suppose raw orders contain order_total, refund_amount, tax_amount, and shipping_amount. Different analysts might independently define net revenue. Instead, an analytical transformation can define the approved business metric once:
SELECT
    order_id,
    customer_id,
    order_date,
    order_total
      - refund_amount
      - tax_amount AS net_revenue
FROM orders;
The SQL itself is not the important part. The important part is that the business definition becomes explicit, reviewable, documented, reusable, and testable.
Separate Raw Data From Business Logic
A useful architecture often separates several stages:
- Source Systems
- Raw Data
- Cleaned Data
- Business Models
- BI / Analytics
Source systems show where information originated. The raw layer preserves what the source actually provided. The cleaned layer handles formats, types, duplicates, and basic quality issues. Business models represent customers, revenue, channels, products, and other concepts. BI and analytics determine how decision makers consume the information.
Keeping these responsibilities separate makes errors easier to diagnose. If dashboard revenue suddenly changes, the team can determine whether the change came from the source, ingestion, transformation, metric definition, or visualization.
A Warehouse Does Not Automatically Fix Data Quality
Centralizing bad data produces centralized bad data. If the CRM contains duplicate customers, moving those records into a warehouse does not remove the duplicates unless the pipeline includes rules for identifying and resolving them.
Similarly, if campaign names are inconsistent—Google_Search, google-search, Paid Search - Google, and SEM_Google—the warehouse will preserve that inconsistency unless transformation logic standardizes it.
A mature pipeline therefore needs quality checks:
SELECT customer_id, COUNT(*)
FROM dim_customer
GROUP BY customer_id
HAVING COUNT(*) > 1;
If customer_id is expected to be unique, this query becomes a simple validation test. Other tests might check null primary keys, impossible dates, negative quantities, orphaned foreign keys, unexpected category values, and abnormal row-count changes.
The goal is not merely moving data. It is increasing confidence in the information used for decisions. See also the site’s data-quality analysis for a related discussion of definitions, joins, and validation.
Data Warehouses and BI Tools Solve Different Problems
A dashboard tool and a warehouse are sometimes treated as alternatives. They are usually different layers.
A BI platform such as Power BI or Tableau helps users analyze and visualize information. A warehouse helps organize and serve analytical data. A dashboard can connect directly to operational systems, which may be reasonable for a small environment. But as complexity increases, embedding transformation logic independently inside many dashboards can create duplicated definitions.
Fragmented reporting
Every dashboard connects independently to every source system.
Governed analytical architecture
Operational systems feed a data platform, governed models, and then BI.
A shared analytical model reduces duplicated definitions. This is the same design question that appears in relational data modeling: where should relationships and business structure be made explicit?
The Cost Question Should Include Analyst Time
Cloud infrastructure cost is visible. Manual analytical work often is not. Suppose an analyst spends 6 hours per week extracting, cleaning, joining, and validating recurring reports. At 50 working weeks, that is 300 hours per year. At an illustrative loaded analytical labor cost of $60 per hour, it is $18,000 per year.
300 × $60 = $18,000 per year
That does not mean a warehouse costing less than $18,000 automatically has positive ROI. Implementation, maintenance, migration risk, training, and opportunity cost also matter. But analyst time belongs in the comparison. The correct comparison is new architecture cost versus the full cost and risk of the current process.
Reliability Has Economic Value Too
Suppose a manually prepared report occasionally contains an incorrect join. The dashboard still loads, and the error may not be discovered for several days. The cost is difficult to measure because it depends on the decisions made from the incorrect information.
This is why data architecture decisions cannot be evaluated only through storage cost. Reliability, reproducibility, auditability, and recovery time also have value.
- pipeline success rate;
- data freshness;
- failed quality tests;
- reconciliation differences;
- dashboard availability;
- time to detect failures;
- time to recover.
Cloud Warehouses Do Not Eliminate Architecture Decisions
Modern platforms can make storage and compute easier to provision. They do not eliminate questions such as:
- What is a customer?
- What counts as revenue?
- Which system owns a field?
- How should history be preserved?
- Which users can access sensitive data?
- How frequently should data refresh?
- What quality checks are required?
- Which transformations belong upstream?
Technology can execute those decisions. It cannot define them without business context.
Build for the Next Decision, Not an Imaginary Future
There are two common architecture mistakes: waiting until reporting becomes unmanageable, and designing infrastructure for a hypothetical company ten years in the future. A more practical approach is incremental.
Stage 1: Direct Analysis
A small number of sources connect directly to analysis or BI.
Stage 2: Repeatable Ingestion
Recurring extracts become automated.
Stage 3: Central Analytical Storage
Important sources are consolidated.
Stage 4: Governed Business Models
Reusable definitions for customers, revenue, products, channels, and other concepts are established.
Stage 5: Monitoring and Scale
Testing, lineage, orchestration, access control, cost management, and reliability become more formal. Not every organization needs Stage 5 today. The architecture should evolve as the cost of the current approach becomes larger than the value of keeping it simple.
A Better Question Than “Do We Need a Data Warehouse?”
Instead of beginning with technology, ask: “Which recurring business decisions are difficult because our data is fragmented, inconsistent, slow, or historically incomplete?”
- How many systems are required?
- How often is the analysis repeated?
- How much transformation is necessary?
- Do teams agree on the metrics?
- Does historical state matter?
- How much manual work is involved?
- What happens when a pipeline or report fails?
- What decisions depend on the result?
If those answers reveal a recurring analytical system rather than occasional analysis, a warehouse may be justified. If they do not, simpler architecture may still be the better decision. The site’s KPI framework discussion offers a related example of why definitions and ownership should be established before reporting grows.
From Data Storage to Decision Infrastructure
The strongest reason to build a data warehouse is not that the company has “a lot of data.” It is that the organization repeatedly needs to turn data from multiple systems into consistent, historical, reproducible information for decisions.
The question stops being “Which warehouse should we buy?” and becomes: “What analytical capability is the business currently missing, and what is the simplest reliable architecture that can provide it?” Sometimes the answer is a modern cloud data warehouse. Sometimes it is a well-designed relational database. Sometimes the company needs better transformations and governance before it needs new infrastructure.
Good data architecture begins by understanding the decision—not by choosing the technology.
Is Your Reporting Process Becoming Harder to Trust or Maintain?
UAD Consulting helps organizations structure data, analytical models, dashboards, and measurement systems around the business decisions they need to make.
Explore ServicesGet in Touch