Imagine opening your company's revenue dashboard on Monday morning. Yesterday's revenue appears to be $300,000. On Tuesday, you check the same reporting date. The dashboard now shows $345,000. By Thursday, the number has increased to $361,000.
Nobody changed the date filter. No new sales occurred on that historical date. Yet the number changed.
Is the dashboard broken? Not necessarily. One possible explanation is that the underlying data arrived late, was corrected, or was processed again after the original report was generated.
This is a common challenge in modern analytics systems. Transactions, website events, payments, CRM updates, and operational records do not always become available to analytical systems when they occur.
The distinction every decision-critical reporting system should understand is this: when something happened is not necessarily when the analytical system learned about it.
That distinction determines whether historical reports remain stable, whether dashboards can be reproduced, and whether management can confidently interpret changes in business performance.
The Short Answer: Historical Metrics Can Change Because Data Arrives After the Reporting Period
A reporting period can end before all relevant information becomes available. An order placed on October 1, for example, might not reach the analytics warehouse until October 3. If the dashboard assigns revenue according to the order date, that transaction belongs to October 1. When the delayed record arrives, the October 1 total increases.
The business activity did not change retroactively. The information available to the reporting system changed.
Historical metrics can also change because of delayed event ingestion, corrected transactions, cancellations or refunds, updated source records, attribution changes, data-pipeline backfills, revised business definitions, and changes to transformation logic.
These situations should not automatically be treated as data errors. But they should be governed explicitly. A reliable reporting system needs to distinguish legitimate revisions from unintended changes. For practical data quality checks for analytics pipelines, freshness alone does not establish completeness, and a successful run does not prove that all expected records were processed.
Three Different Clocks Exist in an Analytics Pipeline
A useful starting point is to separate three timestamps.
1. Event time
Event time describes when the underlying business activity occurred: when an order was placed, a payment authorized, a form submitted, a patient arrived at an emergency department, or a shipment delivered. Event time is often appropriate for operational reporting, but the correct business date depends on the metric definition. Accounting revenue, for example, may follow recognition rules rather than the original order timestamp.
2. Ingestion time
Ingestion time describes when a record entered the analytical system. Suppose an order was placed at 10:00 PM on October 1 and the warehouse received it at 8:00 AM on October 3. Its event time is October 1; its ingestion time is October 3. A dashboard generated on October 2 could not include it unless it was available through another source.
3. Source update time
Source update time describes when the underlying source record was created or modified. An order might originally be recorded as $200, then corrected to $180 two days later. That correction may arrive in the warehouse after it occurs. A well-designed analytical model distinguishes the original event, the source correction, and the time the correction became available.
| Timestamp | Question Answered |
|---|---|
| Event time | When did the business activity occur? |
| Ingestion time | When did the analytical system receive the information? |
| Source update time | When was the source record created or revised? |
The distinction between event time and processing time is fundamental to streaming systems. Apache Beam's programming guide describes event-time windows, watermarks, triggers, and late data. The same principle applies to ordinary batch pipelines and business dashboards.
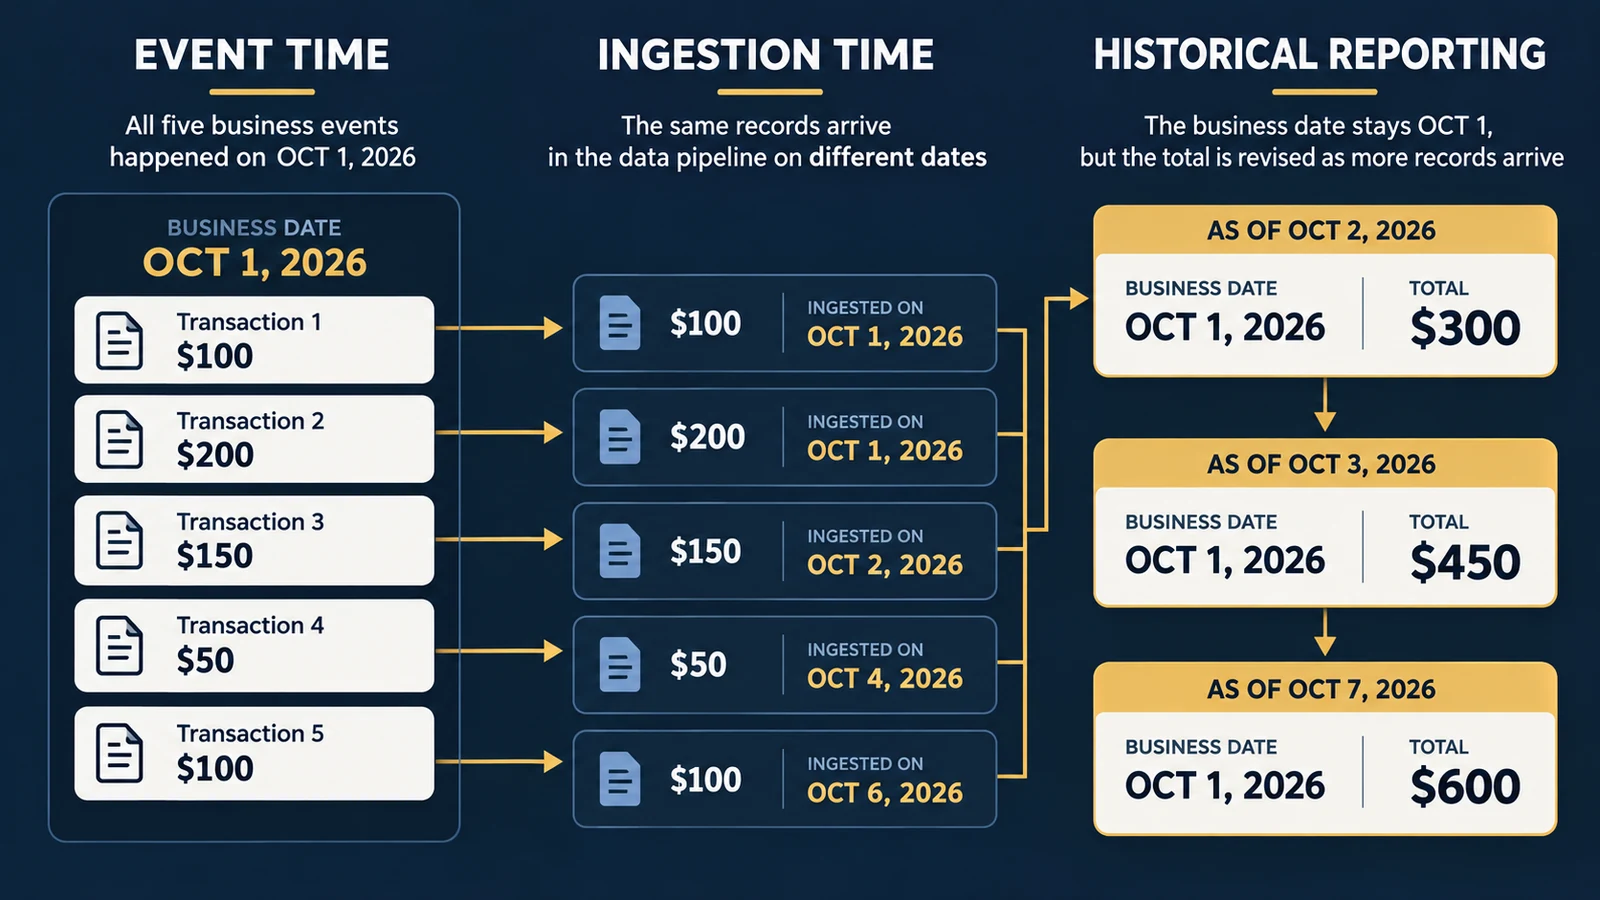
A Worked Example: How $300 Becomes $600 Without Any New Sales on That Date
Consider a small online business. Five orders were placed on October 1, 2026. All five belong to the same business reporting date, but the records reach the analytical warehouse at different times.
| Order | Order Date | Amount | Warehouse Arrival |
|---|---|---|---|
| O101 | October 1 | $100 | October 1, 9:02 AM |
| O102 | October 1 | $200 | October 1, 1:03 PM |
| O103 | October 1 | $150 | October 2, 9:00 AM |
| O104 | October 1 | $50 | October 4, 12:00 PM |
| O105 | October 1 | $100 | October 6, 11:00 AM |
All timestamps use the same business timezone for simplicity. Assume all five orders are completed, none is later corrected, and gross order value is the metric being reported. The eventual total is:
But the dashboard does not know that total immediately. Consider four reporting snapshots:
| Report Generated | October 1 Revenue Visible |
|---|---|
| October 2, 8:00 AM | $300 |
| October 3, 8:00 AM | $450 |
| October 5, 8:00 AM | $500 |
| October 7, 8:00 AM | $600 |
The October 1 total changes four times, although all five orders occurred on October 1. The difference comes from when records became available to the warehouse. This is a hypothetical example designed to demonstrate reporting behavior, not an empirical estimate of typical e-commerce ingestion delays.
Measuring the revision
The earliest snapshot reported $300; the eventual total was $600. The initial snapshot contained:
The upward revision was:
The initially reported revenue doubled after remaining records arrived. This does not mean the business generated 100% additional revenue after October 1. It means the October 1 report was initially incomplete. A manager comparing that first snapshot with a mature historical period could incorrectly conclude that revenue declined; the observed difference might instead reflect inconsistent data maturity.
A Reporting Date Is Not the Same as a Reporting Cutoff
“What was revenue on October 1?” and “What did our reporting system know about October 1 revenue as of October 2 at 8:00 AM?” are different analytical questions.
The first typically asks for the latest available historical total. The second asks for a reproducible historical snapshot. A trustworthy reporting system should make the distinction explicit with a business date, an as-of timestamp, a metric definition, and a data status.
That record is not inherently incorrect. Assuming the pipeline and metric definition are working, it describes what was available at that cutoff. The problem occurs when the number is presented without its reporting context.
Why Simply Refreshing the Dashboard Does Not Solve the Problem
Refreshing a dashboard can update its values. It does not explain why they changed. If yesterday's revenue increases by 15%, possible explanations include missing transactions arriving, duplicate records being removed, order amounts being corrected, refunds being processed, transformation rules changing, reporting timezones changing, or a source-system issue being repaired.
These causes have different implications. A late transaction may be a normal feature of the pipeline; a duplicated order may be a data-quality failure; a revised accounting rule may be an intentional metric-definition change.
To investigate why dashboard numbers don't match, preserve enough information to explain revisions. This connects to broader data quality: freshness alone does not establish completeness, and a successful pipeline run does not establish that all expected records were processed.
Four Ways to Handle Late-Arriving Data
There is no single reporting policy that works for every business. The appropriate approach depends on how information will be used.
1. Continuously updated reporting
Historical metrics are recalculated whenever new information becomes available. Reports reflect the latest records, but previously viewed numbers may change and users may struggle to reproduce earlier decisions. This can work for exploratory and operational dashboards if users understand that recent periods remain subject to revision.
2. Preliminary and settled reporting
A business can distinguish preliminary from settled periods—for example, an initial operational estimate, preliminary reporting, reconciled reporting, and settled analytical reporting. These intervals are illustrative, not universal recommendations. A suitable settlement period should be informed by observed source delays, source-system behavior, and business requirements. A settled analytical period is not necessarily equivalent to a formal accounting close.
3. Frozen historical snapshots
Preserve a report exactly as it appeared at a particular cutoff: October 1 revenue as reported October 2 ($300), and October 1 revenue as reported October 7 ($600). Both values remain available. This helps reconstruct management decisions, forecasting evaluations, regulatory or audit workflows, KPI comparisons, and model backtesting. A timestamp alone is not sufficient if the historical data has already been overwritten.
4. Controlled restatements
A restatement policy can specify which changes justify reopening a period, who approves the revision, how original and revised values are stored, how stakeholders are notified, and whether downstream reports must be regenerated. This matters when figures influence compensation, financial decisions, compliance, or contracts. The goal is not to prevent every historical change, but to make material changes explainable and auditable.
How to Build an As-Of Report in SQL
A practical implementation requires preserving historical versions of source records. Consider an append-only change-log table containing order_id, order_placed_at, source_updated_at, ingested_at, change_version, amount_usd, and status. Each row represents a version of an order received by the analytical system.
The following BigQuery GoogleSQL example reproduces the information available at a historical cutoff:
WITH latest_order_versions AS (
    SELECT
        order_id,
        order_placed_at,
        amount_usd,
        status
    FROM `project.dataset.order_change_log`
    WHERE ingested_at <= @as_of_ts
      AND source_updated_at <= @as_of_ts
      AND order_placed_at <= @as_of_ts
    QUALIFY ROW_NUMBER() OVER (
        PARTITION BY order_id
        ORDER BY
            source_updated_at DESC,
            ingested_at DESC,
            change_version DESC
    ) = 1
)
SELECT
    DATE(order_placed_at, 'America/Chicago') AS business_date,
    COUNTIF(status = 'completed') AS completed_orders,
    SUM(IF(status = 'completed', amount_usd, 0)) AS gross_order_value
FROM latest_order_versions
WHERE DATE(order_placed_at, 'America/Chicago') = @business_date
GROUP BY business_date;
The query uses @as_of_ts for the historical information cutoff and @business_date for the business date. It excludes records unavailable at the cutoff, selects the latest eligible version of each order, and calculates completed-order value for the requested date.
Important implementation assumptions
This example assumes the source change log is append-only; historical versions are retained; ingestion timestamps represent actual availability; source update timestamps are reliable; order IDs uniquely identify logical orders; version ordering is deterministic; monetary amounts use a consistent currency; the source provides complete change history; and deletions and reversals are represented explicitly.
If those assumptions do not hold, the query may not reproduce historical reporting accurately. If a source record is overwritten without preserving its previous version, the old value may no longer be recoverable. A backfill that assigns an artificially early ingestion timestamp can also distort an as-of reconstruction. This is a design illustration, not a complete accounting or production reporting system.
Incremental Pipelines Need a Backfill Strategy
Many analytical pipelines process only new or recently modified records. Incremental processing can reduce unnecessary computation, but a poorly designed pipeline may permanently miss late-arriving information.
Consider a pipeline that processes only records whose event date equals yesterday. An order occurring October 1 but arriving October 4 may never be included because the pipeline has moved past October 1.
One solution is to reprocess a rolling historical window—for example, rebuild the most recent seven business dates every day. This lets late records update previously calculated totals. But the lookback window should not be arbitrary: if relevant records can arrive 30 days late, a seven-day lookback is insufficient.
Alternatively, process changes using ingestion or source-update timestamps and update affected historical partitions. That may be more efficient when delayed events are irregular. The dbt documentation describes incremental model configuration and the use of unique keys for updating existing rows.
Idempotency matters
A reliable pipeline should be idempotent: running the same job twice with the same inputs should not create duplicate business records or double-count values. If a $100 order arrives, the first run inserts it; the second should not create another $100 order simply because the same source record was processed again.
A stable unique key and an upsert are common implementation approaches. BigQuery supports MERGE statements that combine insertion and updates. But keys must be unique at the intended data grain. An upsert is not automatically correct when the source has conflicting versions, duplicate keys, or unhandled deletions; version ordering, corrections, and data integrity still need explicit rules.
A Watermark Is an Estimate, Not a Guarantee
Streaming systems often use watermarks to estimate how far event-time processing has progressed. A watermark helps determine when a reporting window is ready to produce results, but it does not prove no additional historical events will ever arrive.
Apache Beam's overview of the Beam model describes event-time windows and processing-time behavior; its programming guide explains how watermarks and triggers govern late data and additional results after initial window output.
This creates a trade-off: faster reporting versus more complete reporting. Waiting longer may improve completeness but reduce the usefulness of time-sensitive information. A real-time operational dashboard may prioritize speed; a monthly financial reconciliation may prioritize completeness and control; a healthcare workflow may need both timely provisional information and a later validated dataset. The reporting purpose—not a universal latency threshold—determines the policy.
What Should You Monitor in a Late-Data Pipeline?
Monitoring should go beyond asking whether a pipeline ran successfully.
| Metric | What It Reveals |
|---|---|
| Ingestion lag | Time between event occurrence and warehouse arrival |
| P95 ingestion lag | Delay experienced by the slowest 5% of records, approximately |
| Late-arrival share | Proportion arriving after a defined reporting cutoff |
| Historical revision rate | Frequency with which previously reported periods change |
| Revision magnitude | Size of historical metric changes |
| Duplicate-key rate | Potential repeated or conflicting logical records |
| Source-to-warehouse reconciliation | Differences between appropriate source and analytical totals |
| Unprocessed change backlog | Source changes awaiting successful processing |
These measures should be interpreted together. A low median ingestion lag can coexist with a long tail: most transactions may arrive within minutes while a small number arrive days later. Those delayed records may still materially affect revenue if they contain unusually large transactions. Average latency alone may be insufficient.
Measure completeness carefully
Completeness is difficult to measure before the final population is known. In the five-order example, we eventually discovered that the first snapshot contained 50% of the final revenue. But on October 2 the warehouse did not necessarily know that $300 remained missing.
An operational completeness estimate may require historical arrival-delay distributions, expected source volumes, reconciliation against authoritative systems, or source-specific completion signals. Such estimates should be labeled estimates, not proof that every expected record has arrived.
A Practical Reporting Contract
Organizations can reduce confusion by documenting a small set of reporting rules for each important KPI.
1. Business meaning
What exactly does the metric represent? For example, gross completed-order value is not necessarily recognized accounting revenue.
2. Business timezone
Which timezone determines the reporting date? A transaction occurring late in Chicago may belong to a different UTC calendar date.
3. Event-time rule
Which business timestamp determines the period: order creation, payment capture, shipment completion, or revenue recognition?
4. Information cutoff
What information must be available before a report is generated? For example, all records ingested by 8:00 AM Central Time.
5. Revision policy
Can historical values change? If so, for how long and under what circumstances?
6. Reconciliation rule
Which source is authoritative for the metric, and what differences require investigation?
7. Historical reproducibility
Can the organization reproduce the number shown to management last week? If not, what versioning or snapshot mechanism is needed?
These rules form a practical reporting contract between data producers, analysts, and decision-makers. The objective is not excessive documentation; it is ensuring that everyone understands what a reported number represents.
Different Industries Need Different Reporting Cutoffs
Marketing analytics
Website events, advertising costs, conversions, and attribution information may become available on different schedules. A conversion reported for an earlier date may appear after the original dashboard refresh. A revised attribution report is not automatically evidence that advertising caused additional conversions: attribution describes how credit is assigned, while causal incrementality requires a separate identification strategy.
Healthcare analytics
Clinical encounters, procedure codes, claims, and administrative records may be updated after care occurred. An encounter may be clinically completed before all coding or administrative information becomes available. This matters when analysts construct historical cohorts or estimate utilization and costs.
Operations analytics
Shipment statuses, inventory adjustments, fulfillment events, and customer-service records may arrive asynchronously. An operational dashboard may need to provide early estimates while maintaining a later reconciled record.
Financial reporting
Accounting adjustments, settlement processes, and formal closing procedures introduce additional requirements. A continuously updated operational sales metric should not automatically be treated as equivalent to formally recognized revenue. The reporting policy should reflect the economic and accounting definition being used.
When Should a Business Invest in Better Historical Reporting?
Not every organization needs a sophisticated event-processing architecture. A small business with one reliable transaction system and a simple monthly reporting process may manage revisions with documented exports and reconciliation.
A more advanced approach becomes useful when multiple systems feed the same KPI, historical figures change frequently, reports influence significant financial decisions, teams need to reproduce earlier analyses, source records are routinely corrected, late arrivals affect operational planning, or regulatory and audit requirements demand traceability.
Ask: how often do analysts investigate unexplained historical changes? How much time is spent reconciling reports? Have decisions used incomplete data? What is the consequence of using an incorrect or premature number? These questions help determine whether the business needs better monitoring, improved pipeline logic, historical snapshots, or a broader redesign. See UAD's data engineering and database analytics service for related support.
A Changed Dashboard Number Is Not Proof That Business Performance Changed
Suppose a company's dashboard shows that yesterday's revenue increased by 20% after a pipeline update. That observation does not establish that the pipeline update caused a 20% increase in actual sales. The pipeline may simply have loaded transactions that were previously missing.
Similarly, a decrease in reported conversions after a website release does not prove the release caused customers to convert less frequently. The observed metric could have changed because of real customer behavior, instrumentation, delayed processing, consent changes, revised definitions, or incomplete source data.
Before making causal claims about business outcomes, analysts should verify that the measurement process remained consistent. Data integrity is a prerequisite for credible interpretation, not a substitute for causal analysis.
The Better Question Is Not “Why Did the Number Change?”
When a historical metric changes, the first instinct is often to ask which number is correct. A more productive investigation asks:
That question creates an auditable explanation. A reliable analytical system should be able to distinguish:
Once those stages are visible, historical changes become easier to investigate. Some revisions will be legitimate; others will reveal data-quality problems. The important achievement is making the difference observable.
A trustworthy dashboard is not necessarily one whose historical numbers never change. It is one whose numbers have clear definitions, reproducible cutoffs, and explainable revisions.
References
- Apache Beam. Programming Guide — event time, watermarks, triggers, and late data. beam.apache.org/documentation/programming-guide/.
- Apache Beam. Basics of the Beam Model — event-time windows and processing-time behavior. beam.apache.org/documentation/basics/.
- Google Cloud. Data Manipulation Language (DML) Statements in GoogleSQL — including
MERGE. BigQuery documentation. - dbt Developer Hub. Configure Incremental Models. dbt documentation.
- dbt Developer Hub. Add Snapshots to Your DAG — preserving historical versions of mutable sources. dbt documentation.
Make Your Historical Reporting Reproducible
UAD Consulting helps organizations improve data pipelines, reconcile reporting discrepancies, structure analytical databases, and build reliable dashboards that support better business decisions.
Explore ServicesGet in Touch