A company surveys 200 customers. The results show that 62% prefer a proposed new service. Is 200 customers enough to make the decision?
There is no useful universal answer such as “anything above 100 is enough” or “you always need at least 1,000 observations.” Sample size is not simply large or small. It is large or small relative to a specific analytical objective.
Enough to estimate what, with what precision, for which population, and for what decision?
A sample of 200 observations may be more than adequate for one question and weak for another. The answer depends on the quantity being estimated, required precision, confidence level, variability, subgroup analysis, sampling design, weighting, missingness, nonresponse, and the consequence of making the wrong decision. Sample-size planning should begin with the decision rather than a generic minimum number.
Sample Size Controls Precision, Not Truth
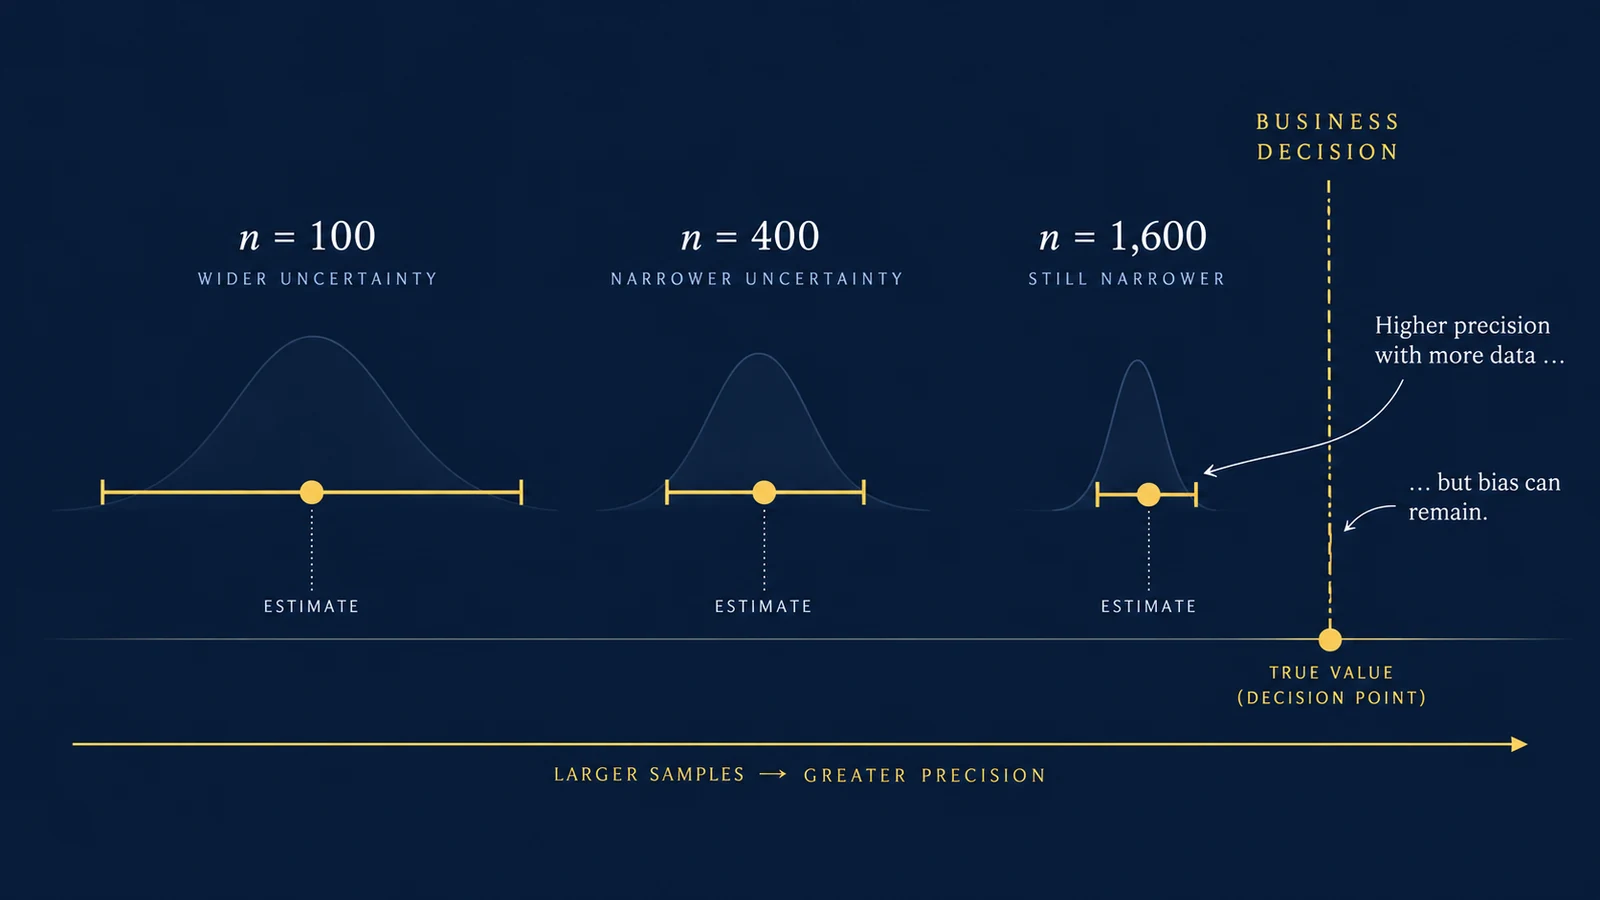
Suppose a business wants to estimate the percentage of customers who would consider purchasing a new service. A survey of 400 randomly sampled customers finds 60% are interested. That 60% is a point estimate; another random sample from the same population would probably produce a somewhat different number.
Sampling uncertainty can be summarized with a confidence interval. Under a simple random-sampling approximation, the standard error of a proportion is:
For p = 0.60 and n = 400:
For a conventional approximate 95% interval, the margin of error is about 1.96 times the standard error:
That is about ±4.8 percentage points, producing an approximate interval from 55.2% to 64.8%. The sample tells us both what we estimated and how precisely we estimated it under the stated sampling assumptions.
What Happens If the Sample Gets Larger?
Suppose the observed proportion remains 60%, but the sample increases:
| Sample size | Approximate margin of error |
|---|---|
| 100 | ±9.6 percentage points |
| 400 | ±4.8 percentage points |
| 1,600 | ±2.4 percentage points |
Increasing the sample from 100 to 400 roughly halves the margin of error; halving it again requires increasing the sample from 400 to 1,600. Sampling error declines roughly with the square root of sample size:
Precision improves with additional observations, but not linearly. Roughly four times as many observations are needed to halve standard error, all else equal. Whether that precision is worth the cost depends on the decision.
Why 385 Appears So Often in Sample-Size Calculators
Many online calculators return a number close to 385. It is not a universal requirement; it follows from a particular formula for estimating a population proportion under simple random sampling:
For 95% confidence (z = 1.96), p = 0.50, and a desired margin of error of 0.05:
The choice p = 0.50 is conservative when the expected proportion is unknown because p(1 − p) is largest at 0.50. Change the desired precision and the answer changes substantially.
| Desired margin of error | Approximate sample required |
|---|---|
| ±10% | 97 |
| ±5% | 385 |
| ±3% | 1,068 |
| ±2% | 2,401 |
| ±1% | 9,604 |
These are large-population simple-random-sampling approximations, not empirical benchmarks. Moving from ±5 to ±1 percentage point takes about 25 times as many observations. That may be justified for a high-stakes decision and wasteful for an exploratory question.
Start With the Decision Threshold
Suppose management will launch a service if at least 55% of customers are likely to adopt it. A survey estimates adoption at 60%, with an approximate 95% interval of 55.2% to 64.8%. The result sits close to the decision boundary.
Another survey also estimates 60%, but with a much wider interval of 50% to 70%. The point estimate is identical, but the second interval extends below the threshold. A decision threshold helps show why these estimates do not support the same confidence in the action.
Required precision depends partly on how close an estimate is to the decision boundary. If every plausible estimate leads to the same action, collecting more data may have little decision value. If modest uncertainty could reverse the decision, additional information may be valuable.
A Sample Can Be Large Overall and Tiny Where It Matters
Suppose a company surveys 1,000 customers, then asks how enterprise customers feel. If only 80 respondents are enterprise customers, the relevant sample for that subgroup is 80—not 1,000. Subgroup estimates generally have more sampling uncertainty because they use fewer observations than estimates based on the full sample.
A dataset may contain 100,000 customers but only 600 from a new product line, 90 in a strategic region, or 45 churned enterprise accounts. The total dataset size does not determine the precision of every analysis. The effective information for the specific question matters.
Segmentation consumes sample size quickly. A dataset with 4,800 observations split across four regions, three customer tiers, and two acquisition channels creates 24 cells, averaging 200 observations per cell only if distribution is even. Real data are rarely even. A dashboard filter does not guarantee that every segment supports a stable estimate; low-volume cells may need to be suppressed, flagged, or contextualized.
More Data Does Not Fix Selection Bias
Suppose a company invites 100,000 customers to a satisfaction survey, but its most engaged customers are more likely to respond. It receives 20,000 responses. That is a large sample, yet it can still be biased if respondents differ systematically from nonrespondents.
Sampling error and bias are different problems. A narrow confidence interval does not certify unbiased data. Question wording, respondent selection, reporting accuracy, and other collection issues can also affect an estimate. CDC describes sample-size calculations as planning guidance and notes that cost, available participants, nonresponse, and data quality also matter. Pew Research Center likewise explains that sampling fluctuation is only one source of survey error.
A carefully sampled study with 500 observations and a voluntary promotional survey with 50,000 responses should not be compared by row count alone. A larger convenience sample can have lower sampling variance while retaining systematic selection problems. This also applies to product data limited to logged-in users, attributable conversions, or a single provider system.
Weighting Can Improve Representation but Reduce Precision
Datasets may be weighted to better represent a target population. If younger customers are underrepresented, analysts may give larger weights to younger respondents. Weighting can improve alignment with known population characteristics but can also increase variance. Pew methodology describes design effects that account for variability from survey design and weighting.
Thus, 1,000 weighted observations do not necessarily have the same precision as 1,000 equally weighted independent observations. One approximation for effective sample size based on weights is:
For equal weights (1, 1, 1, 1), effective n is 16 / 4 = 4. For unequal weights (1, 1, 1, 5), it is 64 / 28 ≈ 2.29. The records remain four, but information is concentrated more heavily in one observation. Raw row count and statistical information are not always the same.
Population Size Often Matters Less Than People Expect
For large populations, the sample needed for a given proportion-estimation precision is often relatively insensitive to total population size. A finite population correction can reduce the requirement when the target population is small:
If n₀ = 385 and the relevant population contains 1,000 customers:
The correction matters when the sample is a meaningful fraction of the finite target population.
Sample Size for an A/B Test Is a Different Problem
The 385 calculation estimates a single population proportion with specified margin of error; it does not determine how many users an A/B test needs. Comparing conversion rates also depends on baseline rate, minimum effect worth detecting, significance level, desired power, group allocation, and design.
If a site converts at 10% and management asks whether a new design increases conversion to 10.2%, that small effect may require a large experiment to detect reliably. If only improvements of at least 12% would change the decision, the required sample may be smaller. Ask what minimum effect is decision-relevant and how much evidence is needed to detect it.
Statistical Significance Is Not Business Significance
Large samples can make tiny differences statistically detectable. A change from 5.000% conversion to 5.050% might be distinguishable from sampling noise with enough observations. But is a 0.05 percentage-point increase economically meaningful after implementation cost, risk, complexity, and opportunity cost?
Sample-size planning should connect statistical detectability to a decision-relevant effect. Ask both “Can we detect this difference?” and “Would it matter if it were real?”
Small Samples Are Not Automatically Useless
A small sample usually means greater uncertainty for statistical estimation, but not that no useful decision information exists. A B2B company may have only 40 enterprise clients in its segment; reliable data on 30 may cover much of the target population. Carefully selected qualitative interviews can also reveal process problems that a large transaction dataset cannot explain. Match the method to the question.
Confidence Intervals Do Not Capture Every Source of Uncertainty
A 95% interval from a simple formula usually addresses sampling variability under specific assumptions. It does not automatically account for nonresponse bias, measurement error, incorrect labels, model misspecification, seasonality, changing behavior, unmeasured confounding, poor survey wording, or pipeline errors.
CDC’s sample-size guidance frames calculations as a rough planning aid and also highlights cost, available subjects, nonresponse, answer accuracy, and transcription. An interval is not a complete certificate of certainty; it quantifies a particular source of uncertainty under a particular model.
Correlation Does Not Become Causal With a Larger Sample
Suppose a dataset contains one million customers, and users of Feature A have 20% higher retention. The association may be estimated precisely, but Feature A users may differ in engagement, experience, plan, or onboarding. More data can reduce sampling uncertainty without solving causal identification. Causal conclusions require an appropriate research design and assumptions, not simply a larger n.
A Practical Sample-Sufficiency Framework
Instead of asking whether the sample is “large enough,” evaluate these five questions:
- What decision are we supporting? State the action, such as launching if estimated adoption is sufficiently above 55%.
- What quantity are we estimating? Adoption, average order value, conversion lift, churn, cost difference, and model performance need different planning.
- How much uncertainty can the decision tolerate? Define useful precision or a minimum detectable effect; do not choose a conventional figure without a reason.
- What is the effective sample for this analysis? Consider subgroups, missing data, weighting, clustering, repeated observations, and exclusions.
- What errors remain if sampling precision is excellent? Evaluate selection bias, measurement, confounding, and model assumptions.
This turns sample-size planning from a statistical ritual into decision support.
A Decision-Oriented Example
A company evaluating a premium support service will proceed if expected adoption exceeds 50%. A pilot survey of 100 estimates adoption at 56%:
The interval crosses 50%; management may find uncertainty too high. A survey of 900 comparable customers still estimates 56%:
The point estimate did not change, but precision did. Under the simplified assumptions, the larger study provides stronger evidence that adoption exceeds the threshold. “Enough data” means enough information to support the decision at acceptable uncertainty.
When More Data Has High Decision Value
Additional data are especially valuable when the estimate is close to a decision threshold, uncertainty could reverse the preferred action, the decision is costly or difficult to reverse, important subgroups are poorly represented, or a modest increase in information could improve the decision.
More data may have lower value when uncertainty is already small relative to the threshold, every plausible result leads to the same action, the decision is reversible, or remaining uncertainty comes primarily from bias rather than sampling variability. Data collection has a cost; decision errors have a cost. Good analytics balances the two.
What Should a Business Report Instead of Just n?
A report should rarely stop at “sample size = 427.” A more useful summary includes:
- Sample size: 427 respondents
- Estimate: 61% adoption
- Approximate 95% interval: 56% to 66%
- Target population: active U.S. customers
- Important limitation: enterprise customers represent only 38 respondents
- Decision threshold: 55% adoption
A dashboard can display observation count, estimate, confidence interval, subgroup count, and a low-sample warning. This is more informative than presenting every KPI as though every segment had equal stability. The principles behind which KPIs belong on a dashboard also apply to uncertainty context beside a metric.
The Better Question
There is no universal minimum sample size for business analytics. Instead of asking “Is 200 enough?” ask “What can 200 observations tell us with enough precision to support this decision?” Then examine:
Decision → Estimand → Required Precision → Sampling Design → Effective Sample → Bias and Measurement → Decision Threshold
More observations are useful when they meaningfully reduce uncertainty. But a large dataset is not automatically representative, causal, accurate, or decision-ready. The objective is not to collect the largest possible sample; it is to collect enough reliable information to make a better decision.
References / Further Reading
Turn Data Into Decision-Ready Evidence
UAD Consulting helps businesses evaluate analytical evidence, quantify uncertainty, and design reporting and decision frameworks around the questions that actually matter.
Explore ServicesGet in Touch