A dashboard tells you that churn risk is 62%. A forecasting model expects demand to fall 8%. A marketing report shows conversion rate below target. A hospital operations model flags a patient flow bottleneck.
What should you do next?
That question exposes an important distinction between analytics and decision analytics. An analysis estimates, describes, predicts, or compares something. A decision requires an action rule: under what conditions should the organization intervene, wait, investigate, escalate, or do nothing?
A useful analytics system therefore should not stop at a score, forecast, or KPI. It should connect evidence to a decision threshold that reflects uncertainty, data quality, intervention cost, and the consequences of being wrong.
This article develops a practical framework for doing that.
A Prediction Is Not Yet a Decision
Suppose a customer churn model assigns a customer a 60% probability of leaving.
The number by itself does not tell the business whether to offer a retention incentive.
Should the threshold be 50%? 60%? 80%?
There is no universally correct cutoff. The appropriate threshold depends partly on the economics of the decision.
Imagine that:
- successfully retaining an otherwise-lost customer produces $180 in expected contribution;
- contacting the customer and providing the offer costs $30;
- customers who would have stayed anyway may also receive the $30 offer.
If the estimated probability of churn is p, a simplified expected-value calculation for intervening is:
The break-even point occurs when:
Therefore: p = 30 / 180 = 16.7%
Under these assumptions, a customer does not need a churn probability above 50% for intervention to have positive expected value. The economically relevant threshold is approximately 16.7%.
That does not mean every customer above 16.7% should automatically receive an offer. Capacity constraints, model calibration, treatment effectiveness, customer experience, uncertainty, and other considerations still matter.
But it demonstrates an important principle:
The Cost of False Positives and False Negatives
Threshold decisions create at least two important types of mistakes.
A false positive occurs when the system recommends an intervention that was unnecessary. A false negative occurs when the system fails to intervene when intervention would have been valuable.
The two errors rarely have equal business consequences.
Consider a simplified fraud-screening example.
| Decision outcome | Business consequence | Illustrative cost |
|---|---|---|
| Correctly allow legitimate transaction | Normal processing | $0 |
| Review legitimate transaction | Unnecessary review/friction | $8 |
| Correctly review fraudulent transaction | Fraud potentially prevented | Review cost |
| Miss fraudulent transaction | Fraud loss | $300 |
If unnecessary review costs $8 while a missed fraudulent transaction costs $300, optimizing only for classification accuracy may produce the wrong operating rule.
A threshold should instead reflect the tradeoff the organization actually faces.
This principle extends beyond machine learning. Similar tradeoffs occur when deciding whether to:
- increase inventory before demand materializes;
- pause a marketing campaign;
- investigate a KPI anomaly;
- schedule preventive maintenance;
- escalate an operational case;
- contact an at-risk customer;
- allocate clinical or administrative resources.
The analytical question is not simply “Which outcome is most likely?”
It is often “Which action has the best expected consequence given what we currently know?”
A Four-Part Framework for Setting an Action Threshold
A practical decision threshold can be built around four questions.
1. What Exactly Is the Decision?
Define the action before choosing the metric.
“Monitor churn” is not a decision.
“Offer a $30 retention incentive to customers whose predicted churn risk exceeds the action threshold” is.
Likewise, “track ROAS” is not a complete decision rule. “Reduce campaign spend by 20% when expected incremental return falls below the required return after accounting for uncertainty” is closer to one.
Clear action definitions prevent dashboards from accumulating metrics that have no operational consequence.
2. What Are the Consequences of Each Error?
Create a simple decision table.
For a binary intervention, the structure may look like this:
| Actual condition | Intervene | Do not intervene |
|---|---|---|
| Problem would occur | Benefit − intervention cost | Cost of missed opportunity/problem |
| Problem would not occur | Unnecessary intervention cost | $0 |
Populate the cells with the best available estimates.
They do not need to be perfect. Even approximate economics can reveal that a conventional 50% cutoff has little connection to the real decision.
3. How Uncertain Is the Estimate?
A point estimate can create false precision.
Suppose two regional dashboards both report a 6% decline:
- Region A: estimated decline 6%, with a narrow uncertainty range
- Region B: estimated decline 6%, with a much wider uncertainty range
The headline number is identical, but the evidence is not equally informative.
This matters when the decision is near a threshold.
If management acts whenever expected decline exceeds 5%, an estimate of 6% should not automatically be treated as incontrovertible evidence that the underlying decline exceeds 5%.
Uncertainty should influence whether the organization acts immediately, gathers more information, or uses a more conservative decision rule.
4. Is the Underlying Data Fit for This Decision?
Sophisticated threshold logic cannot rescue unreliable input data.
Before triggering an action, check whether the information feeding the decision is sufficiently:
- fresh,
- complete,
- valid,
- consistent,
- accurate,
- unique.
The practical implication is straightforward.
A revenue alert based on yesterday’s complete transaction table and the same alert based on a partially loaded table are not equivalent evidence.
The decision system therefore needs two kinds of thresholds:
- Business thresholds — when the metric warrants action.
- Data-quality thresholds — when the metric is trustworthy enough to use.
A Worked Example: When Should a Campaign Be Paused?
Consider a company reviewing a paid campaign.
Assume:
- normal daily spend: $2,000
- expected contribution generated from that spend: $2,500
- expected daily net contribution: $500
- an analytics alert suggests campaign performance has deteriorated
- if deterioration is real, continuing for another day is expected to lose $900
- pausing a campaign that is actually healthy creates an estimated $400 opportunity cost
Let p represent the probability that the deterioration is real.
Expected cost of pausing: (1 − p) × $400
The break-even threshold occurs when the two expected costs are equal:
900p = 400 − 400p
1,300p = 400
p ≈ 30.8%
In this simplified example, once the probability that deterioration is real exceeds about 30.8%, pausing has the lower expected cost.
Notice how different that is from saying:
“Pause when we are more than 50% certain.”
The 30.8% threshold emerges from the asymmetric consequences of the two mistakes.
If the opportunity cost of pausing rose to $1,000, the threshold would change:
1,900p = 1,000
p ≈ 52.6%
Same analytical model. Different business economics. Different optimal threshold.
That is why thresholds should not be copied mechanically across organizations, campaigns, customers, hospitals, or operating environments.
Correlation, Prediction, and Causality Are Different Questions
Expected-value calculations also require an important caution.
Suppose customers with churn scores above 70% who receive retention offers subsequently churn less often.
That observation does not by itself establish that the offer caused the improvement.
Customers receiving the offer may differ systematically from those who did not. Agents may selectively intervene. Campaign timing may differ. Other customer characteristics may influence both treatment and outcome.
A predictive model estimates an outcome under observed patterns. A causal question asks what would happen because an intervention was made.
Those are different estimands.
When the value calculation depends on the incremental effect of an intervention—such as the probability that a discount actually prevents churn—randomized experiments or appropriate causal-inference designs are preferable when feasible.
Without causal evidence, the model can still support prioritization, but the expected benefit attributed to the intervention should be presented as an assumption or observational estimate rather than a proven causal effect.
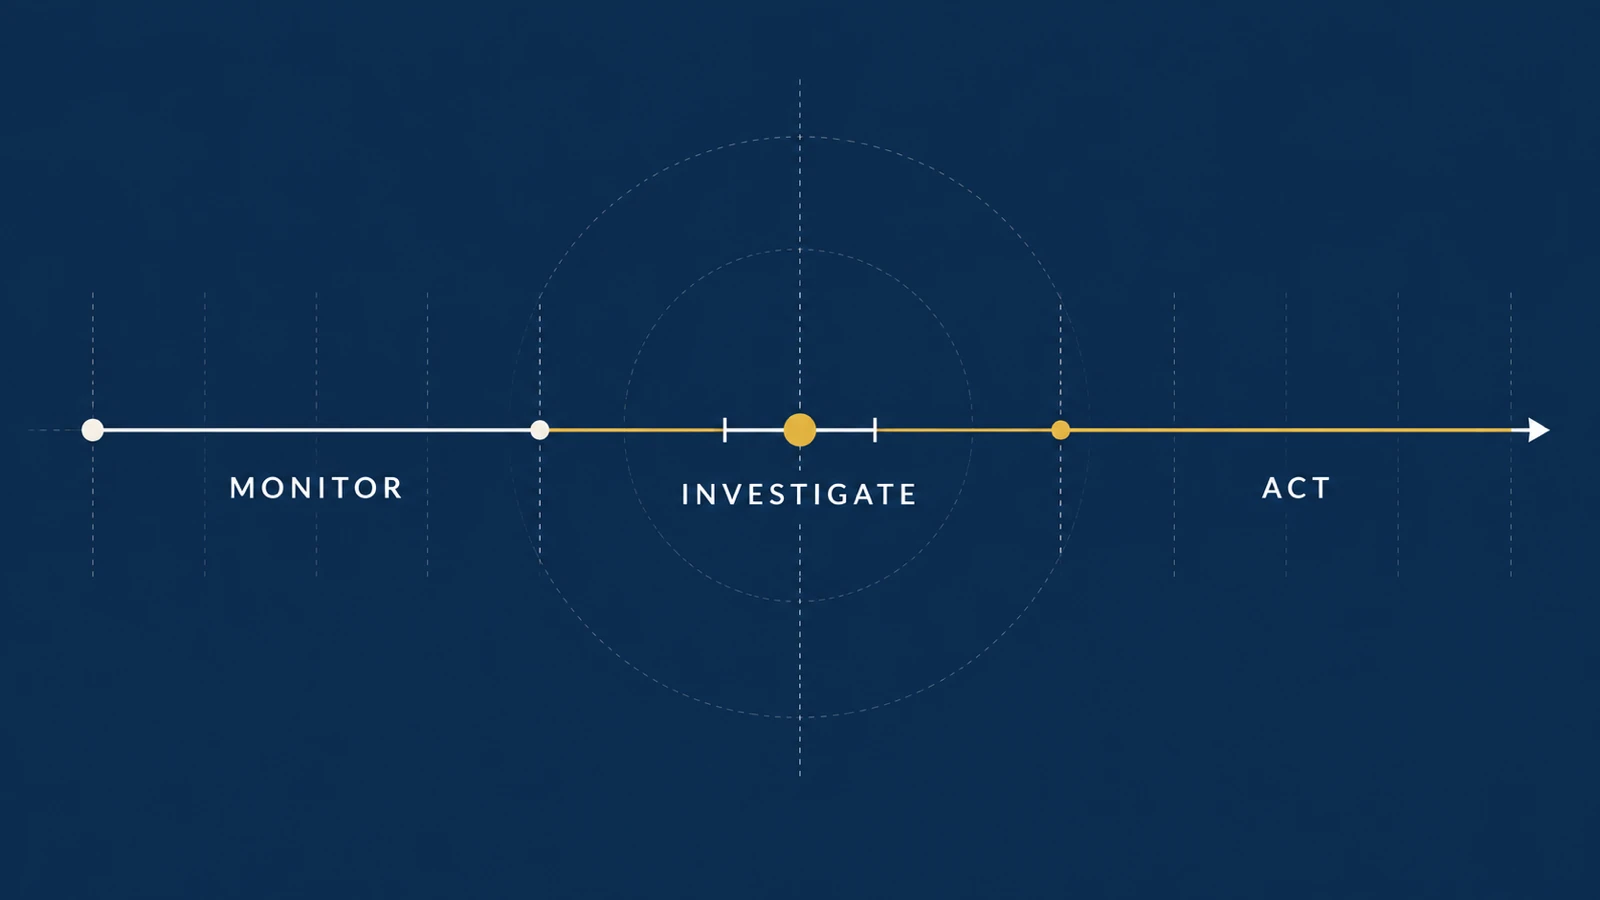
Thresholds Should Sometimes Create Three Decisions, Not Two
Many business systems force every observation into:
Act / Do not act
A better design can include an uncertainty zone:
Act — evidence is sufficiently strong and the expected economics support intervention.
Investigate — evidence is near the decision boundary or data quality is questionable.
Do not act — expected benefit does not justify intervention.
| Churn risk | Decision |
|---|---|
| Below 15% | No proactive offer |
| 15%–25% | Review additional customer information |
| Above 25% | Trigger retention workflow |
These numbers are illustrative, not universal recommendations.
The middle zone is useful when measurement uncertainty, intervention capacity, or consequences make an automatic binary decision too aggressive.
It also creates an operational role for human judgment without abandoning analytical consistency.
Thresholds Can Change When Capacity Is Constrained
Expected value alone may suggest acting on thousands of cases, while the organization can process only hundreds.
Suppose 10,000 customers have positive expected intervention value, but the retention team can contact only 1,000 per week.
The problem is no longer simply:
Does expected value exceed zero?
It becomes:
Which 1,000 available actions produce the highest expected incremental value subject to capacity?
That is a prioritization or optimization problem.
The decision pipeline becomes:
- Data
- Estimate
- Uncertainty
- Expected Consequence
- Constraint → Ranked Action
This is one reason predictive analytics and decision analytics should be connected rather than treated as separate exercises. A model may rank risks accurately while still producing little operational value if its output is not connected to costs, constraints, and feasible actions.
A Useful Dashboard Should Expose the Decision Logic
If a threshold drives action, stakeholders should be able to understand why it exists.
A decision-oriented dashboard might show:
- current estimate;
- action threshold;
- uncertainty interval or reliability indicator;
- expected cost of acting;
- expected cost of not acting;
- data freshness;
- relevant capacity constraint;
- recommended action.
That design is different from simply adding more charts.
The objective of data visualization and BI is not maximum visual density. For operational decisions, the interface should make the relationship between evidence and action legible.
Likewise, the underlying data engineering and database layer should preserve definitions, timestamps, transformation logic, and quality checks so that the organization can determine where a decision-driving number came from.
A clear KPI framework can also make the relevant thresholds, owners, and decision rules explicit.
When Should a Threshold Be Recalibrated?
A threshold is not necessarily permanent.
Revisit it when:
- Economics change. Intervention cost, customer value, labor cost, or loss severity may change.
- Model performance changes. A score may become less well calibrated as the population or environment shifts.
- Capacity changes. A team that can process 2,000 cases may rationally use a different operational cutoff than a team that can process 200.
- Data changes. A new source, delayed pipeline, altered tracking implementation, or changed definition can affect the evidence feeding the rule.
- The intervention changes. A $10 incentive and a $100 incentive should not automatically use the same threshold.
Threshold monitoring should therefore be part of the analytics lifecycle rather than a one-time configuration decision.
From Dashboards to Decisions
Organizations often invest heavily in collecting data, engineering pipelines, creating dashboards, and developing predictive models.
Those capabilities answer important questions:
What happened?
Why might it have happened?
What is likely to happen next?
But many organizations ultimately need one more layer:
Given the evidence, what should we do?
A defensible answer connects the analytical output to the economics of action, the consequences of errors, uncertainty, data quality, and operational constraints.
That does not eliminate judgment. It makes the assumptions behind judgment more explicit.
And that is the difference between merely reporting a number and designing analytics around a decision.
References
Have a Decision Worth Modeling?
UAD Consulting helps translate business questions into analytical frameworks that connect data, uncertainty, and business consequences to practical decisions.
Explore Services Get in Touch