Imagine a company using machine learning to identify customer support tickets that require urgent attention.
The model appears successful.
Its classification accuracy is 93%.
Management is pleased. The analytics team reports that the model correctly classifies most incoming tickets, and the company begins using its predictions to prioritize support requests.
But operational problems remain.
Some genuinely urgent tickets are still being missed. These cases can lead to service-level violations, customer dissatisfaction, and expensive corrective work.
Meanwhile, the support team has limited capacity to manually review tickets.
Management faces a practical question:
Should the company adjust the model so that more tickets receive urgent review, even if doing so reduces its reported accuracy?
The answer depends on the consequences of different errors, the cost of taking action, and the organization's operational constraints.
A model's statistical accuracy and the economic value of the decisions made with it are not necessarily the same thing.
The Short Answer: Optimize the Decision, Not Just the Classification Score
A classification threshold determines when a model's output triggers a particular decision.
For a binary classifier, the system might estimate the probability that a support ticket is urgent.
A threshold of 0.70 means tickets with predicted probabilities of at least 70% are classified as urgent.
A threshold of 0.30 means tickets with predicted probabilities of at least 30% are classified as urgent.
Lowering the threshold generally increases the number of tickets flagged for review.
That can reduce missed urgent cases, but it can also increase unnecessary reviews.
The business should therefore evaluate the trade-off between:
- The cost of reviewing a ticket.
- The cost of failing to identify an urgent ticket.
- The number of tickets requiring review.
- The available operational capacity.
- The reliability of the model's predictions.
- The consequences of acting on those predictions.
The best threshold is not necessarily 0.50, and the threshold producing the highest accuracy is not necessarily the one producing the lowest business cost.
This distinction is central to cost-sensitive classification.
Scikit-learn's guidance on classification thresholds explains why the threshold used to convert model scores into class predictions should be considered separately from the model's underlying predictive estimates [1].
Why Classification Accuracy Can Be Misleading
Classification accuracy measures the proportion of observations assigned the correct class.
For binary classification:
This metric treats every correctly classified observation as one success and every incorrectly classified observation as one error.
But businesses rarely experience every error as equally costly.
Consider a support-ticket classification system.
A false positive occurs when a normal ticket is incorrectly flagged as urgent.
The organization may spend time reviewing a ticket that did not require special attention.
A false negative occurs when a genuinely urgent ticket is classified as normal.
The organization may fail to respond quickly enough, creating more serious consequences.
Both outcomes count as one error in an accuracy calculation.
Their business costs, however, may be very different.
A company that minimizes the number of classification mistakes may not minimize the financial consequences of those mistakes.
A Worked Example: Two Classification Thresholds
Consider a hypothetical business processing 1,000 support tickets.
Of those tickets:
- 100 genuinely require urgent attention.
- 900 do not require urgent attention.
The company has developed a classification model that assigns each ticket an urgency score.
Management is considering two thresholds.
Policy A uses a relatively high threshold of 0.70.
Policy B uses a lower threshold of 0.30.
Both policies use the same underlying model and the same 1,000-ticket evaluation dataset.
Only the classification threshold changes.
Assume the following results.
| Classification Outcome | Threshold 0.70 | Threshold 0.30 |
|---|---|---|
| True positives | 60 | 85 |
| False positives | 30 | 150 |
| False negatives | 40 | 15 |
| True negatives | 870 | 750 |
| Total tickets | 1,000 | 1,000 |
These numbers are hypothetical and were constructed to demonstrate the trade-off between classification accuracy and business cost.
The two sets of predictions are consistent with lowering the threshold: additional urgent and nonurgent tickets become classified as positive.
Step 1: Calculate Classification Accuracy
For Threshold 0.70:
For Threshold 0.30:
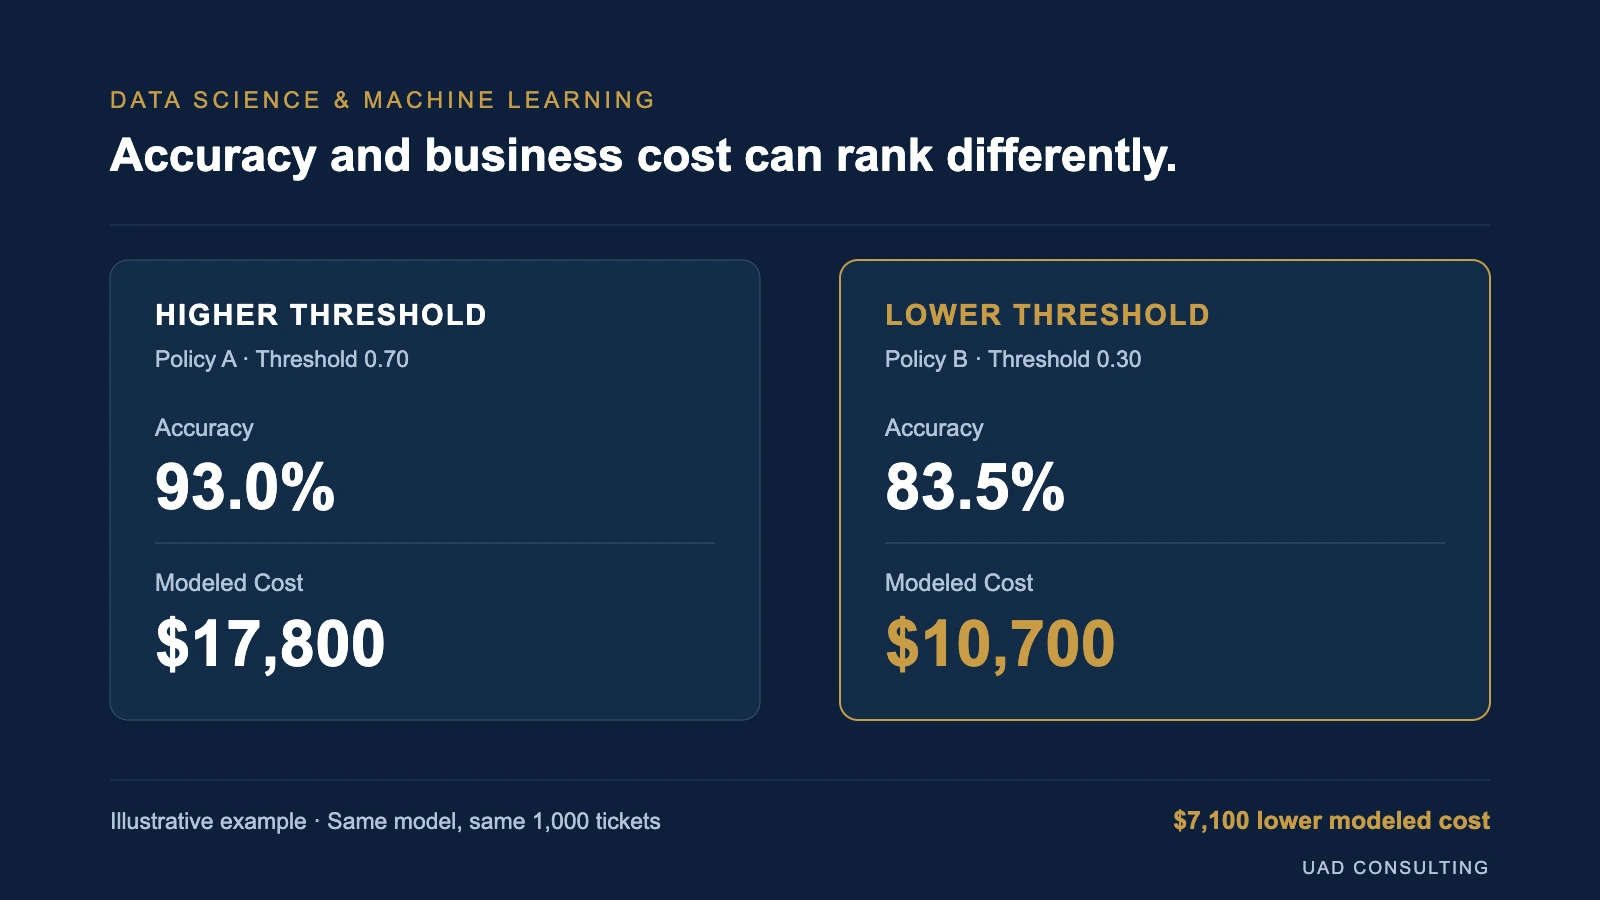
According to accuracy alone, Threshold 0.70 is clearly superior.
It correctly classifies 93% of tickets, compared with 83.5% for the lower threshold.
But accuracy does not tell us how much either policy costs.
Step 2: Calculate Precision and Recall
Precision measures the proportion of flagged tickets that are genuinely urgent.
For Threshold 0.70:
For Threshold 0.30:
The higher threshold is more precise.
A larger proportion of its flagged tickets are genuinely urgent.
Now consider recall.
Recall measures the proportion of genuinely urgent tickets successfully identified.
For Threshold 0.70:
For Threshold 0.30:
The lower threshold identifies substantially more urgent tickets.
It also generates many more reviews.
Neither precision nor recall alone determines which policy is economically preferable.
The answer requires a cost model.
Step 3: Assign Costs to Operational Decisions
Suppose management estimates that manually reviewing a flagged ticket costs $20.
This includes the incremental labor and processing resources associated with urgent review.
Assume that failing to identify a genuinely urgent ticket creates an additional avoidable cost of $400.
For this simplified example, assume:
- Every ticket flagged as urgent receives manual review.
- Each review costs $20, regardless of whether the ticket is genuinely urgent.
- Reviewing a genuinely urgent ticket prevents the modeled $400 missed-urgency loss.
- A genuinely urgent ticket that is not reviewed incurs the $400 loss.
- Unflagged nonurgent tickets generate no incremental cost in this comparison.
- Review capacity is initially assumed sufficient.
- The same cost assumptions apply to both thresholds.
These are illustrative modeling assumptions, not measured industry averages.
In reality, review effectiveness may be imperfect, costs may vary by customer or ticket, and some urgent cases may still produce losses despite intervention.
Under the stated assumptions:
Threshold 0.70
Reviewed tickets:
Review cost:
Missed urgent tickets:
40
Missed-urgency cost:
Total modeled cost:
Threshold 0.30
Reviewed tickets:
Review cost:
Missed urgent tickets:
15
Missed-urgency cost:
Total modeled cost:
The lower threshold produces more manual reviews.
But it also prevents more costly missed cases under the model assumptions.
The resulting comparison is:
| Metric | Threshold 0.70 | Threshold 0.30 |
|---|---|---|
| Accuracy | 93.0% | 83.5% |
| Precision | 66.7% | 36.2% |
| Recall | 60.0% | 85.0% |
| Tickets reviewed | 90 | 235 |
| Missed urgent tickets | 40 | 15 |
| Review cost | $1,800 | $4,700 |
| Missed-urgency cost | $16,000 | $6,000 |
| Total modeled cost | $17,800 | $10,700 |
Threshold 0.30 reduces modeled cost by:
Percentage reduction relative to Threshold 0.70:
Under these hypothetical conditions, the lower-accuracy classification policy produces approximately 40% lower modeled cost.
That does not mean lower accuracy is generally desirable.
It means accuracy is not the correct objective when different errors have different economic consequences.
Why the Result Depends on the Cost Assumptions
The previous example assumed that missing an urgent ticket costs $400.
But what if that estimate is uncertain?
Suppose the actual avoidable cost is closer to $100.
The economic comparison changes.
For Threshold 0.70:
For Threshold 0.30:
Now the higher threshold is less expensive.
The classification model has not changed.
The confusion matrices have not changed.
Only the assumed economic consequence of a missed urgent ticket has changed.
This demonstrates why threshold selection should include sensitivity analysis rather than rely on a single cost estimate.
Calculate the Break-Even Missed-Urgency Cost
Let C represent the cost of missing an urgent ticket.
For Threshold 0.70:
For Threshold 0.30:
The policies have equal modeled cost when:
Therefore:
- If the missed-urgency cost exceeds $116, Threshold 0.30 has lower modeled cost.
- If the missed-urgency cost is below $116, Threshold 0.70 has lower modeled cost.
- At exactly $116, the two policies have equal modeled cost.
This result applies only to the two evaluated policies and their hypothetical confusion matrices.
It does not establish that either threshold is globally optimal.
Other thresholds may produce better results.
Nevertheless, the calculation is useful because it identifies which economic assumption changes the preferred decision.
Instead of debating whether the model is accurate enough, management can ask:
"Is the avoidable cost of missing an urgent ticket likely to exceed $116?"
That is a more decision-relevant question.
The Best Threshold May Be Limited by Operational Capacity
Cost minimization is not the only constraint.
Suppose the support team can review only 120 tickets per day.
For this capacity illustration, assume that the 1,000-ticket evaluation batch represents one day's workload.
Threshold 0.70 generates 90 reviews.
Threshold 0.30 generates 235 reviews.
The lower threshold appears financially preferable under the original cost assumptions, but it exceeds available review capacity.
A policy that cannot be implemented is not an operationally feasible solution.
Management may need to:
- Select an intermediate threshold.
- Review only the highest-priority tickets.
- Increase review capacity.
- Introduce different escalation levels.
- Improve the review process.
- Use expected intervention benefit to prioritize cases.
If review costs and missed-case consequences vary, ranking tickets only by predicted urgency may not be sufficient.
A more useful prioritization score may be:
This formula assumes the predicted probability is appropriately calibrated and that review prevents the modeled avoidable loss.
If intervention effectiveness is less than 100%, the expected avoided loss must be adjusted accordingly.
Operational optimization should also account for staffing, processing time, deadlines, service commitments, and fairness requirements.
The objective is not merely to find a threshold that looks good in a statistical report.
It is to design a decision policy the organization can actually execute.
Why 0.50 Is Not Automatically the Correct Classification Threshold
Many binary classification systems use 0.50 as a default probability threshold.
This is convenient, but it is not a universal economic optimum.
Suppose the model provides a calibrated probability that a ticket is urgent.
Under the simplified assumptions from our example:
- Reviewing a ticket costs $20.
- Missing an urgent ticket costs $400.
- Reviewing an urgent ticket completely prevents that loss.
- There are no capacity constraints or additional costs.
If the company does not review a ticket, the expected missed-urgency cost is:
If the company reviews the ticket, the cost is $20.
Review is economically preferable when:
Therefore:
The break-even probability is 5%.
Under these restrictive assumptions, a calibrated urgency probability above 5% would justify review.
This does not mean every business should adopt a 5% classification threshold.
The result depends on the cost estimates, intervention effectiveness, calibration, and operational constraints.
It also differs from the earlier $116 calculation.
The 5% figure is a theoretical decision rule for an individual ticket under simplified expected-cost assumptions.
The $116 figure compares the aggregate modeled costs of two particular classification policies.
They answer different questions.
Scikit-learn's cost-sensitive learning example illustrates how thresholds can be selected according to business objectives rather than default classification conventions [2].
Probability Calibration Matters
A model can rank cases effectively without producing reliable probability estimates.
Suppose a classifier assigns 100 tickets an urgency probability of approximately 0.80.
If its probabilities are well calibrated, we would expect roughly 80% of comparable tickets assigned probabilities near 0.80 to be genuinely urgent over an appropriate evaluation sample.
Calibration describes how closely predicted probabilities correspond to observed outcome frequencies.
It is different from discrimination.
Discrimination concerns whether the model tends to rank urgent tickets above nonurgent tickets.
Calibration concerns whether the numerical probability estimates are reliable.
A model can have strong ranking performance but poor calibration.
This matters when business decisions use formulas such as:
If the probability is systematically too high or too low, the resulting expected-cost calculation can be misleading.
Calibration can be examined using reliability diagrams, calibration curves, and appropriate probability-scoring metrics.
Scikit-learn provides tools for probability calibration and calibration-curve evaluation [3].
Calibration should be assessed on data not improperly reused from model fitting, and the evaluation should represent the intended deployment population.
A calibrated model is not automatically a causally valid decision system.
It provides better probability estimates under the conditions represented by the calibration data.
AUC, Accuracy, Precision, and Business Cost Answer Different Questions
Machine learning reports often present several performance metrics.
These metrics should not be treated as interchangeable.
| Metric | What It Measures | What It Does Not Establish |
|---|---|---|
| Accuracy | Proportion of correct classifications | Economic value of decisions |
| Precision | Share of flagged cases that are positive | Cost of missed cases |
| Recall | Share of positive cases identified | Cost of unnecessary actions |
| ROC AUC | Ranking discrimination across thresholds | Optimal operating threshold |
| Probability calibration | Agreement between predicted probabilities and observed frequencies | Causal intervention effectiveness |
| Modeled decision cost | Cost under specified actions and assumptions | Guaranteed real-world savings |
Changing the threshold of a fixed scoring model changes its class predictions.
It does not, by itself, change the underlying ranking scores.
Therefore, threshold changes can alter accuracy, precision, recall, and modeled cost without changing the model's ROC AUC.
A strong model evaluation should report the measures relevant to the intended decision.
How Should a Business Choose a Classification Threshold?
A practical implementation process begins with the decision, not the algorithm.
1. Define the Operational Action
Specify what happens when the model flags a case.
Will an employee review it?
Will a customer receive an intervention?
Will an order be delayed?
Will a maintenance inspection be scheduled?
The action determines which costs and benefits matter.
2. Define the Prediction Target
Specify the outcome, prediction horizon, and population.
For example:
"Identify tickets likely to require urgent intervention within the next 24 hours."
This is more precise than predicting whether a ticket is generally important.
3. Estimate the Consequences of Each Decision
Identify relevant costs associated with:
- Correctly reviewing an urgent case.
- Unnecessarily reviewing a nonurgent case.
- Missing an urgent case.
- Correctly leaving a nonurgent case unreviewed.
Some costs may be direct financial expenditures.
Others may involve customer experience, operational risk, contractual obligations, or delayed service.
Avoid presenting uncertain assumptions as precise measured facts.
4. Evaluate Multiple Thresholds
Use a validation dataset that represents the intended deployment environment.
For each candidate threshold, calculate:
- True positives.
- False positives.
- False negatives.
- True negatives.
- Review workload.
- Relevant performance metrics.
- Modeled business cost.
Where possible, evaluate uncertainty around these results.
5. Apply Operational Constraints
Exclude policies that violate staffing, capacity, timing, legal, or other operational requirements.
If a policy requires 235 daily reviews but only 120 are possible, its apparent financial advantage is not sufficient.
6. Protect the Final Evaluation
Threshold tuning is part of model selection.
Repeatedly choosing thresholds based on the final test dataset can overfit the threshold to that dataset.
Use appropriate training, validation, calibration, and independent testing procedures.
For time-dependent business data, ensure the evaluation respects prediction timing and information availability.
This is closely related to the broader issue of data leakage and production validation.
7. Monitor the Policy After Implementation
A threshold selected using historical data may become less appropriate when conditions change.
Monitor:
- Incoming case volume.
- Positive-class prevalence.
- Calibration.
- Precision and recall.
- Review capacity.
- Operational costs.
- Intervention effectiveness.
- Relevant customer or service outcomes.
A change in prevalence can affect precision even if the model's underlying ranking performance remains relatively stable.
Changes in costs or staffing can also alter the preferred decision threshold without requiring a completely new predictive model.
Prediction Is Not the Same as Causal Business Impact
Our worked example calculated the modeled costs associated with different classification policies.
It did not demonstrate that implementing Threshold 0.30 would necessarily save $7,100 in a real business.
That distinction matters.
The example assumed that reviewing an urgent ticket completely prevents the associated missed-urgency loss.
But this is a causal assumption about the effectiveness of intervention.
A model might correctly identify a high-risk case without the subsequent review successfully preventing the negative outcome.
Similarly, the observed relationship between a model score and urgency does not establish that acting on the score improves business performance.
To estimate real intervention value, the organization needs evidence about what changes when the intervention occurs.
Depending on the business context, a controlled pilot, randomized rollout, or appropriately designed observational evaluation may help estimate incremental effects.
A business should distinguish:
Predictive performance: How accurately does the model estimate or rank outcomes?
Decision performance: How well does the resulting policy allocate actions and resources?
Causal impact: How much does implementing the policy change outcomes compared with a credible alternative?
These are related but different questions.
For a broader discussion of connecting predictions to actions, see From Predictive Analytics to Decision-Making.
A Better Scorecard for Classification Systems
A decision-focused model dashboard should combine statistical and operational measures.
| Dimension | Suggested Measures | Decision Question |
|---|---|---|
| Prediction quality | ROC AUC, precision, recall | Does the model identify relevant cases? |
| Probability quality | Calibration, probability error | Can estimated risks support decisions? |
| Classification policy | Threshold, confusion matrix | Which cases trigger action? |
| Operational capacity | Reviews, processing time, backlog | Can the organization execute the policy? |
| Economic outcomes | Review costs, missed-case costs | What are the modeled consequences? |
| Stability | Drift, prevalence, calibration changes | Does the policy remain appropriate? |
| Business impact | Incremental outcomes where identifiable | Does implementation improve results? |
Not every metric belongs on the executive dashboard.
Leadership may need to see total cost, capacity utilization, missed critical cases, and policy performance.
Analysts need access to the underlying confusion matrices, probability distributions, threshold comparisons, and validation results.
The purpose is not to maximize the number of metrics.
It is to connect model behavior with the decisions management must make.
Frequently Asked Questions
Is a 0.50 classification threshold always optimal?
No. A threshold of 0.50 is a common default for binary probability classification, but it does not necessarily minimize business costs or satisfy operational constraints.
The preferred threshold depends on the relative consequences of different decisions, the reliability of predicted probabilities, and the organization's objectives.
Can lowering a classification threshold improve business performance?
Yes, under some conditions.
Lowering a threshold can identify more positive cases while also increasing false positives.
If the avoided cost of additional false negatives exceeds the cost of additional reviews, the lower threshold may produce better modeled economic outcomes.
However, this depends on valid cost assumptions and operational feasibility.
Does a higher ROC AUC guarantee a better business decision?
No.
ROC AUC measures ranking discrimination across thresholds.
It does not directly incorporate review costs, intervention effectiveness, operational capacity, or the consequences of classification errors.
A model with lower AUC may still support a better decision policy in a particular application.
Should a company retrain its model to change the classification threshold?
Not necessarily.
The classification threshold can often be changed without retraining the underlying predictive model.
However, the revised threshold should be validated.
If the model's predictions are poorly calibrated, its ranking performance has deteriorated, or the deployment population has changed substantially, additional calibration or retraining may be necessary.
Can classification thresholds be optimized automatically?
Yes.
Threshold optimization can evaluate candidate thresholds against a specified business objective, subject to appropriate validation and operational constraints.
Tools such as scikit-learn's TunedThresholdClassifierCV support threshold selection using cross-validation and a chosen scoring objective.
Automation does not eliminate the need to define meaningful costs, protect evaluation data, and validate operational outcomes.
The Best Classification Policy Is the One That Supports the Decision
Return to the support-ticket example.
Threshold 0.70 achieved 93% accuracy.
Threshold 0.30 achieved only 83.5%.
Yet under the original hypothetical cost assumptions, the lower threshold reduced modeled cost from $17,800 to $10,700.
The result changed when the assumed cost of missing an urgent ticket changed.
It also became operationally infeasible when available review capacity was limited to 120 tickets.
These comparisons illustrate why classification should be evaluated as part of a decision system.
The appropriate threshold depends on more than statistical performance.
It depends on the consequences of errors, intervention costs, prediction quality, operational constraints, and the evidence supporting expected business outcomes.
The objective is not to make a machine learning model look impressive.
It is to make better decisions using reliable predictions.
References and Further Reading
[1] Scikit-learn documentation. "Tuning the Decision Threshold for Class Prediction." Official scikit-learn user guide.
[2] Scikit-learn documentation. "Post-tuning the Decision Threshold for Cost-Sensitive Learning." Official scikit-learn example.
[3] Scikit-learn documentation. "Probability Calibration." Official scikit-learn user guide.
All worked-example values are hypothetical and are not empirical estimates of actual support-ticket operations.
Connect Machine Learning to Business Decisions
UAD Consulting helps organizations connect predictive modeling, statistical evaluation, and business decision-making.
Whether the challenge involves classification, operational prioritization, model validation, or interpreting predictive results, the objective is to establish a clear relationship between analytical evidence and practical decisions.
Explore Data Science & Machine Learning consulting to discuss a classification or predictive analytics challenge.
Explore ServicesGet in Touch