A machine learning model can perform well when it is deployed and become less useful months later.
That does not necessarily mean the model is broken. The environment around it may have changed. Customers behave differently. Product mixes change. Economic conditions shift. New acquisition channels appear. Operational processes are redesigned. The data pipeline itself may change.
This creates an important business question:
When should a production machine learning model actually be retrained?
A common answer is: “When the data drifts.” That is incomplete. Data drift is an important warning signal, but a change in input data does not automatically mean the model has become materially worse. Conversely, a model can become less valuable even when its input distributions appear relatively stable.
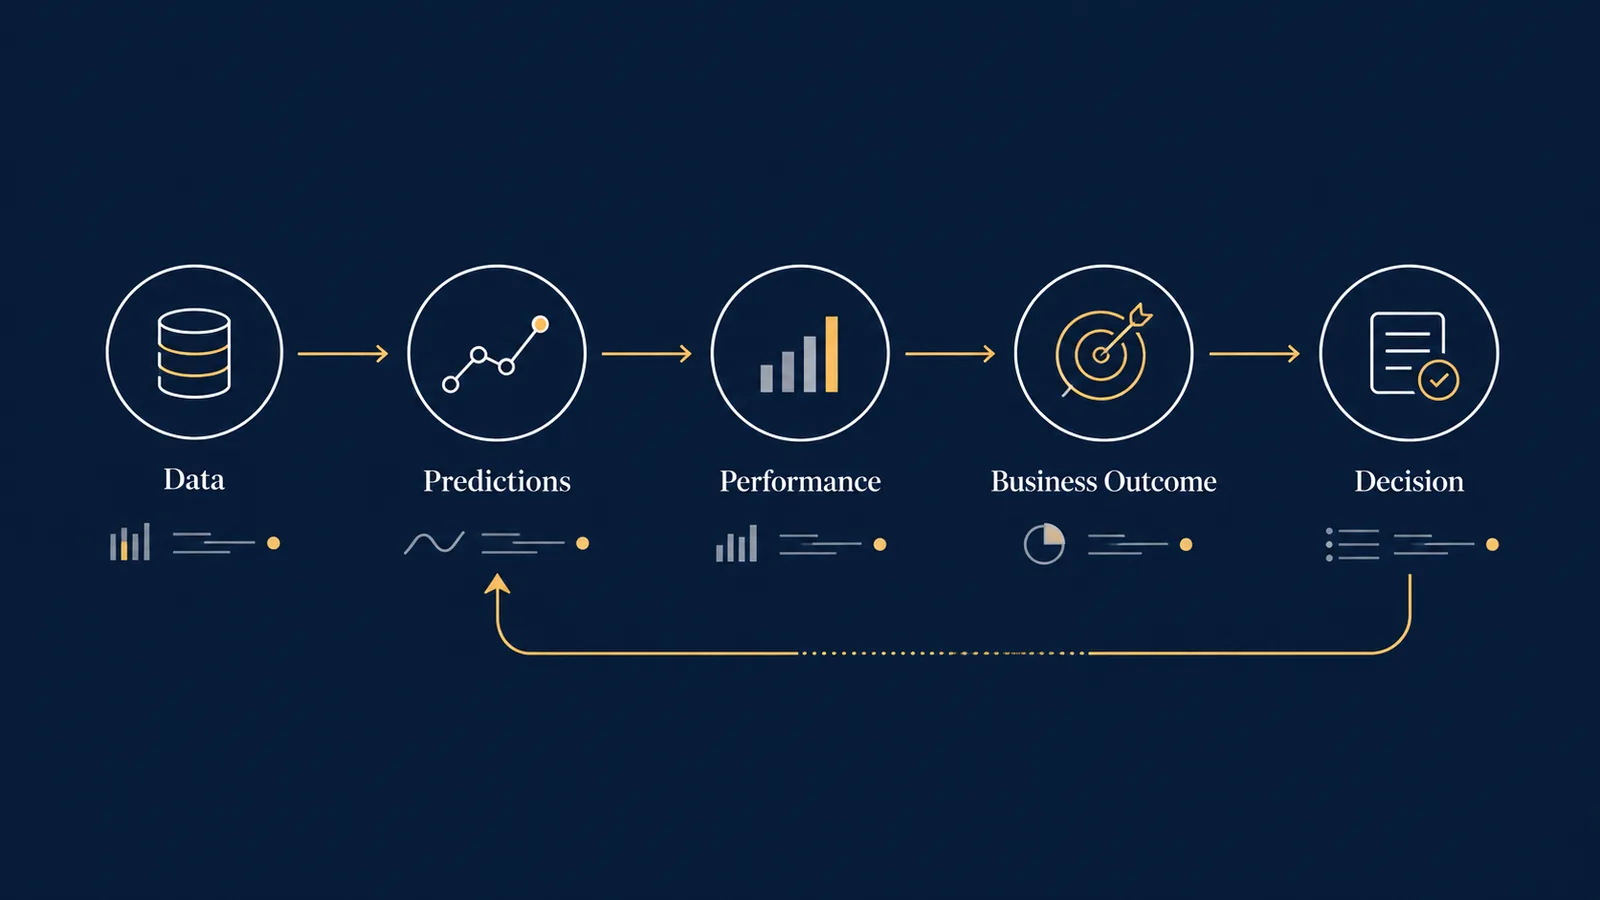
A better retraining decision combines several layers of evidence:
- Data
- Predictions
- Model Performance
- Business Outcomes
- Decision
The objective is not to keep a model statistically unchanged. The objective is to determine whether the model remains useful for the decision it was built to support.
What Is Model Drift?
Model drift generally describes deterioration in a model’s usefulness as the environment generating its data changes. IBM describes model drift as degradation in model performance caused by changes in data or in relationships between inputs and outputs.
Several different phenomena are often grouped under the word “drift.”
Data Drift
The distribution of an input variable changes. Suppose a credit-risk model was trained when 25% of applicants were under 30, median income was $68,000, and 15% were self-employed. Six months later, those figures are 40%, $59,000, and 27%. The production population no longer resembles the training population as closely. That deserves investigation, but it does not yet prove that model accuracy deteriorated.
Prediction Drift
The distribution of model outputs changes. A churn model that historically classified 12% of customers as high risk might now classify 24%. Customers may genuinely be at greater risk, the input population may have changed, an upstream field may be wrong, or the model may be encountering unfamiliar cases. Prediction drift is a signal, not a diagnosis.
Concept Drift
The relationship between predictors and the outcome changes. Suppose delivery delay historically predicted customer churn strongly, then the company introduces automatic compensation for delayed orders. Delivery delay may occur at the same frequency while its relationship with churn weakens. Monitoring inputs alone may not reveal that problem.
Drift Does Not Automatically Mean Retrain
Imagine a model uses customer age. During training, mean age was 42; six months later, it is 45. Should the model immediately be retrained? Not necessarily. If production AUC remains approximately unchanged, calibration remains acceptable, and the business intervention continues producing similar results, retraining merely because one feature moved may add operational work without improving the decision.
Now consider the opposite situation. Input distributions appear stable, but conversion behavior changes after a competitor launches a new product. The relationship between customer characteristics and purchase probability may have changed even though a simple feature-drift dashboard looks normal.
Drift detection should trigger investigation—not automatically trigger retraining.
The Five-Layer Model Monitoring Framework
A useful monitoring system separates five questions. Each layer can fail independently.
| Layer | Question | Example |
|---|---|---|
| Data | Has the production population changed? | Income distribution shifted |
| Prediction | Are model outputs changing? | High-risk predictions rose from 12% to 21% |
| Performance | Is predictive quality deteriorating? | Precision fell from 0.71 to 0.59 |
| Business | Is the model still improving the target decision? | Retention cost per saved customer increased |
| Operations | Is the system functioning correctly? | Missing features or latency increased |
Google’s production ML guidance similarly recommends monitoring serving-data drift, prediction drift, missing or corrupted values, model-quality metrics, latency, and outages rather than treating production monitoring as a single accuracy check.
A Worked Example: Churn Model
Suppose a subscription company uses a churn model to decide which customers receive a retention offer.
| Metric | Baseline |
|---|---|
| Customers scored monthly | 100,000 |
| High-risk customers | 12,000 |
| Precision among contacted customers | 70% |
| Average intervention cost | $25 |
| Average retained contribution | $160 |
If all 12,000 high-risk customers are contacted, expected true high-risk customers are 12,000 × 70% = 8,400. If 20% are retained because of the intervention, that is 1,680 retained customers and an estimated retained contribution of 1,680 × $160 = $268,800. Intervention cost is 12,000 × $25 = $300,000. Under these simplified assumptions, the campaign already requires careful evaluation.
Six months later, prediction drift causes the model to classify 20,000 customers as high risk while precision falls to 50%. True high-risk customers contacted are 10,000. At the same 20% intervention effectiveness, 2,000 customers are retained, producing $320,000 in contribution against $500,000 in intervention cost.
The model may still identify more genuinely at-risk customers, but the decision system has become economically worse. Model monitoring should therefore not stop at predictive metrics.
Accuracy Can Improve While Business Value Falls
Consider two model versions:
| Metric | Model A | Model B |
|---|---|---|
| Accuracy | 82% | 86% |
| Precision at intervention threshold | 71% | 61% |
| Customers contacted | 10,000 | 17,000 |
| Intervention cost | $250,000 | $425,000 |
| Expected retained contribution | $290,000 | $350,000 |
| Net modeled contribution | $40,000 | −$75,000 |
Model B has higher overall accuracy, yet Model A creates better modeled economics under this decision policy. The relevant question is how model performance interacts with the decision rule and the economics of acting.
Monitor the Decision Threshold Too
Suppose a customer receives an intervention when predicted churn probability is at least 0.60. That threshold was chosen when the retention offer cost $20, customer contribution was $150, and intervention effectiveness was 25%. A year later the offer costs $35. Even if predictive performance is unchanged, the economically appropriate threshold may change.
Model retraining and decision-policy recalibration are different actions. Sometimes you need a new model. Sometimes you need a new threshold. Sometimes you need neither.
What Should Be Monitored?
1. Input Data
Monitor important features for missingness, unexpected categories, range violations, distribution shifts, and schema changes. Google recommends validating production data against expected schemas and statistical properties.
2. Prediction Distribution
Track average predicted probability, the percentage above the action threshold, prediction quantiles, and class distribution. Sudden changes can reveal genuine population change or technical problems.
3. Model Quality
When ground truth becomes available, monitor precision, recall, ROC-AUC, PR-AUC, calibration, MAE, or RMSE as appropriate. Performance around the action threshold may matter more than an aggregate metric across every threshold.
4. Business Outcomes
Track metrics linked to the decision itself. For churn, this may include customers contacted, intervention cost, retained customers, contribution retained, and cost per incremental retention. For fraud, it may include review cost, fraud captured, false-positive burden, and losses prevented.
5. Operational Health
Monitor scoring latency, pipeline failures, missing features, stale data, API errors, model version, and feature version. A statistically strong model cannot create value if its production pipeline is unreliable.
Use Thresholds for Investigation, Not Blind Automation
Illustrative monitoring rules might include:
| Signal | Investigation threshold |
|---|---|
| Missingness | More than a 2 percentage-point increase |
| High-risk prediction rate | More than 25% relative change |
| Precision | More than 10% relative decline |
| Calibration error | Exceeds defined tolerance |
| Business KPI | More than 15% deterioration |
| Model age | 180 days |
These numbers are illustrative, not universal standards. Their purpose is to create operational discipline.
- Alert
- Diagnose
- Quantify Impact
- Choose Response
The response might be to fix the data pipeline, recalibrate probabilities, change the decision threshold, retrain, collect additional labels, investigate a business-process change, or temporarily fall back to a previous model. Automatically retraining whenever any metric crosses a threshold can hide the actual problem.
When Ground Truth Arrives Late
Many production models have delayed labels. A churn prediction made today might not be verifiable for 60 or 90 days; a loan-default model may require much longer. Real-time accuracy cannot always be calculated.
Google notes that production systems may need proxy metrics when ground truth is unavailable immediately. For churn, interim signals might include cancellation-page visits, support complaints, payment failures, or engagement decline. But a proxy is not ground truth, and a good dashboard should label it accordingly.
Retraining on a Schedule vs. Retraining on Evidence
Calendar-Based Retraining
Retraining every week, month, quarter, or year is simple and predictable, but the schedule may be unrelated to whether the model needs updating.
Evidence-Based Retraining
Retraining when monitoring indicates meaningful deterioration or structural change can be more efficient, but it requires stronger monitoring infrastructure.
A practical compromise is scheduled evaluation with evidence-based retraining: evaluate data, predictions, performance, and business outcomes monthly; conduct a deeper model review quarterly; and retrain only when predefined evidence indicates that an updated model is likely to improve the decision.
Compare the Candidate Against the Production Model
Retraining creates a candidate model. It does not automatically create a better model. The candidate should be compared with the production model on appropriate validation data.
| Metric | Production | Candidate |
|---|---|---|
| ROC-AUC | 0.81 | 0.84 |
| Precision at action threshold | 68% | 73% |
| Monthly interventions | 14,000 | 12,500 |
| Estimated intervention cost | $350,000 | $312,500 |
The candidate appears promising because improvement occurs not only in an aggregate metric but also around the operational decision. That is stronger evidence for replacement.
Retraining Is Not Evidence of Causal Impact
Suppose the new model is deployed and customer retention improves from 84% to 87%. That does not automatically prove the model caused the improvement. Pricing, promotions, seasonality, customer mix, product quality, and competitor activity may also have changed.
Model performance asks whether predictions are accurate. Business monitoring asks whether outcomes are improving. Causal evaluation asks how much of the change occurred because of the model-driven intervention. Where feasible, randomized experiments or carefully designed quasi-experimental approaches provide stronger evidence about incremental business impact.
A Practical Retraining Decision Matrix
| Data Drift | Performance Decline | Business Deterioration | Likely Action |
|---|---|---|---|
| Low | Low | Low | Continue monitoring |
| High | Low | Low | Investigate; retraining may not be needed |
| Low | High | High | Investigate concept drift; retraining likely |
| High | High | High | Diagnose pipeline and model; retraining may be appropriate |
| Low | Low | High | Review threshold, economics, and business process |
The final row is particularly important. This is closely related to the decision-threshold framework: a business problem may require a policy change rather than a new model. If business performance deteriorates while model quality remains stable, retraining may solve nothing. The problem may be outside the model.
Model Monitoring Is a Business Process
Machine learning projects often devote substantial attention to feature engineering, algorithm selection, hyperparameter tuning, and validation metrics. Those activities matter. But deployment changes the question from “Can this model predict?” to “Is this model still helping us make a better decision?”
NIST’s AI Risk Management Framework reflects this broader lifecycle perspective by organizing AI risk-management activities around Govern, Map, Measure, and Manage, rather than treating model development as the end of the process.
A production model should therefore be treated as a monitored decision system. The broader data science and machine learning consulting question is how to keep that system useful after deployment. The strongest retraining policy is not “Retrain every 90 days,” nor is it “Retrain whenever drift appears.” It is: monitor the data, predictions, model performance, operational system, and business decision—and retrain when the combined evidence indicates that updating the model is likely to improve the decision.
That is what turns machine learning from a one-time modeling exercise into an operational analytical capability.
References / Further Reading
Is Your Predictive Model Still Supporting the Right Decision?
UAD Consulting helps organizations connect predictive modeling, monitoring, decision thresholds, and business outcomes so analytical models remain useful after deployment.
Explore ServicesGet in Touch