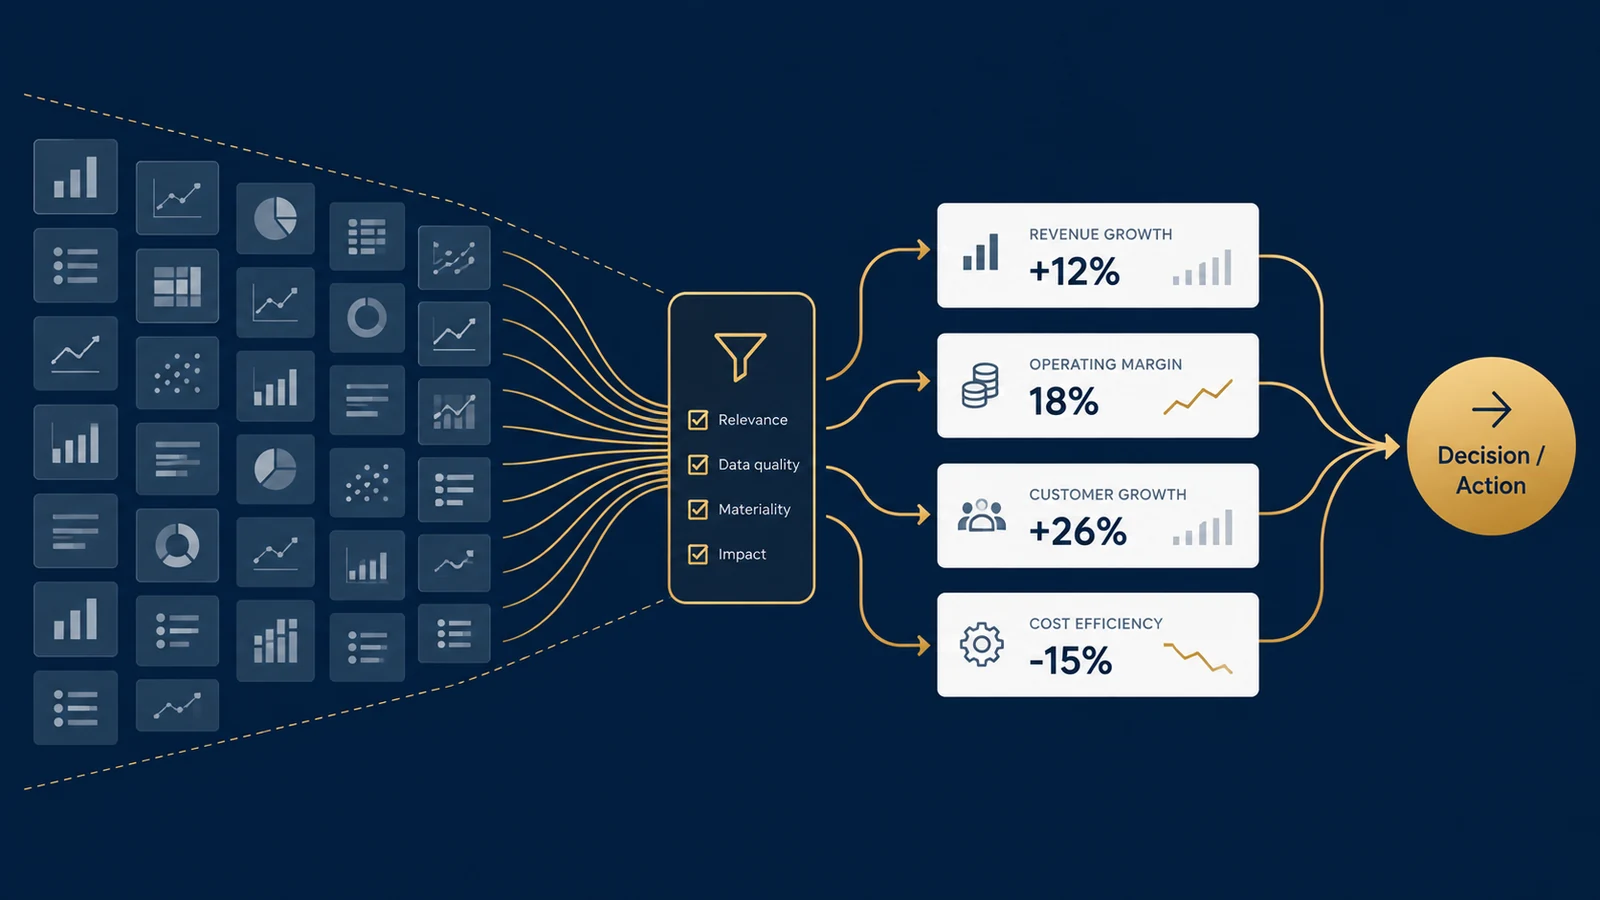
A company has 47 metrics available. How many belong on its executive dashboard? The answer is not 47. It is also not automatically five, ten, or any other universal number.
The better question is: Which metrics can change a decision?
Organizations often build dashboards backward. They begin with the data they have, create charts for available measures, arrange those charts on a screen, and then ask stakeholders whether the dashboard looks useful. That process can produce a polished reporting interface without producing a useful decision tool.
A stronger approach reverses the sequence:
- Decision
- Question
- Metric
- Threshold
- Action
- Visualization
The dashboard is the final layer, not the starting point.
A Dashboard Is Not a Data Inventory
Suppose a marketing team can measure impressions, clicks, CTR, CPC, CPM, sessions, engaged sessions, conversions, conversion rate, revenue, ROAS, CAC, new customers, returning customers, bounce rate, and average engagement time.
All of these metrics can be legitimate. That does not mean they deserve equal space on the same dashboard.
An executive deciding whether to reallocate marketing budget has a different information need from an analyst investigating why paid-search conversion declined yesterday. The underlying data may be identical. The appropriate dashboard is not.
Microsoft's Power BI dashboard guidance recommends designing around the audience, emphasizing the most important information, and removing nonessential information when a dashboard becomes cluttered. Tableau similarly recommends considering audience and purpose before designing a visualization, with executive audiences generally receiving more aggregated KPIs than row-level operational detail.
The first dashboard-design question should therefore be: Who is making what decision?
Start With the Decision
Consider an ecommerce company reviewing marketing performance every Monday. The leadership team must decide whether to maintain current channel budgets, move budget between channels, investigate an underperforming channel, or change the offer or landing experience.
Now KPI selection becomes easier. A metric deserves prominent dashboard space when it helps distinguish between those actions.
| Metric | Possible decision relevance |
|---|---|
| Spend | How much capital is being deployed? |
| Revenue | What commercial output is associated with that activity? |
| CAC | What does acquiring a customer cost? |
| Conversion rate | Is traffic turning into customers efficiently? |
| Marginal ROAS | Would additional spending likely remain productive? |
| Impressions | Potential diagnostic context, but rarely sufficient for budget allocation alone. |
The distinction is not that impressions are “bad” and CAC is “good.” Different metrics answer different questions.
The Decision-to-KPI Test
Before adding a KPI to a dashboard, ask five questions.
1. What decision does this metric inform?
If nobody can name the decision, the metric may belong in an exploratory report rather than the primary dashboard.
2. What action could change because of it?
A useful KPI should have a plausible response. For example: inventory days above a threshold may trigger purchasing or demand investigation; CAC materially above target may trigger a review of channel economics; service level below target may trigger an operational capacity review.
3. Compared With What?
A number without context is difficult to interpret. The useful information may be: Conversion rate 3.8% | Target 4.5% | Prior period 4.3%.
4. Who Owns the Response?
A dashboard can identify a problem without solving it. Without ownership, alerts can become passive decoration.
5. How Quickly Can the Decision Change?
A warehouse supervisor may need hourly information, a CFO may review cash-flow forecasts weekly, and a board may evaluate strategic metrics quarterly. Refreshing every dashboard every five minutes does not make every decision more analytical.
A Practical KPI Selection Score
Organizations can formalize the discussion using a simple selection framework. This is not an industry standard; it is a decision aid.
Score each candidate KPI from 0 to 2 on five dimensions.
| Dimension | 0 | 1 | 2 |
|---|---|---|---|
| Decision relevance | No clear decision | Indirect | Direct |
| Actionability | No defined action | Investigation possible | Clear response |
| Interpretability | Context unclear | Some context | Clear target/comparison |
| Ownership | No owner | Shared/unclear | Named owner |
| Timeliness | Too slow/fast | Partially aligned | Matches decision cadence |
Maximum score: 10.
| Metric | Decision | Action | Context | Owner | Timing | Total |
|---|---|---|---|---|---|---|
| Revenue | 2 | 2 | 2 | 2 | 2 | 10 |
| CAC | 2 | 2 | 2 | 2 | 2 | 10 |
| Conversion rate | 2 | 2 | 2 | 2 | 2 | 10 |
| ROAS | 2 | 2 | 2 | 2 | 2 | 10 |
| Impressions | 1 | 1 | 1 | 2 | 2 | 7 |
| Average session duration | 1 | 1 | 1 | 1 | 2 | 6 |
This does not prove that the first four metrics are objectively superior. The scoring system forces stakeholders to explain why a metric deserves scarce dashboard attention. That conversation is often more valuable than the score itself.
KPI, Diagnostic Metric, and Dimension Are Different
One reason dashboards become crowded is that three different analytical objects are treated as if they were all KPIs.
KPI
A metric directly connected to performance against an important objective, such as customer acquisition cost.
Diagnostic Metric
A measure used to investigate why a KPI changed, such as landing-page conversion rate.
Dimension
A way of slicing a metric, such as channel, region, product, or device.
Suppose CAC rises from $82 to $108. The executive dashboard needs to surface the CAC deterioration. The analyst may then investigate CAC by channel, conversion rate by device, CPC by campaign, and customer mix by geography. Those diagnostic views are valuable, but placing every diagnostic breakdown permanently on the executive dashboard can obscure the signal that initiated the investigation.
Use an Information Hierarchy
A useful dashboard can be structured in three levels:
- Level 1 — What happened? Core KPIs and exceptions.
- Level 2 — Where did it happen? Important segments, trends, and comparisons.
- Level 3 — Why might it have happened? Diagnostic detail.
This creates an analytical path:
- Signal
- Context
- Investigation
Tableau recommends using a logical visual flow, placing more important content prominently, and using detail progressively. It also recommends limiting the number of views where possible because too many views can reduce clarity and affect performance.
Worked Example: Executive Marketing Dashboard
Suppose management reviews five channels: Paid Search, Paid Social, Organic Search, Email, and Affiliate. The objective is profitable customer acquisition.
An analyst proposes a dashboard with Revenue, New Customers, CAC, Contribution Margin; Revenue by Channel, CAC by Channel, Weekly Conversion Trend; and campaign, device, keyword, landing-page, and audience tables. The dashboard contains useful information, but it mixes executive monitoring and analyst investigation.
A cleaner structure might be:
Executive Dashboard
Revenue | New Customers | CAC | Contribution Margin
Then: CAC vs. Target by Channel, followed by Revenue / Customer Trend. If a channel exceeds its CAC threshold, the user can drill into a diagnostic report containing campaigns, devices, keywords, audiences, and landing pages. The information has not disappeared; it has been moved to the level where it becomes useful.
Thresholds Turn Metrics Into Decision Signals
Consider CAC: Current CAC = $108. Without context, that is just a number.
The dashboard can communicate: CAC: $108 | 20% above target.
Suppose the company defines:
- ≤ $90 → normal;
- $91–$105 → monitor;
- > $105 → investigate before increasing spend.
Now the KPI participates in a decision rule. These thresholds are business assumptions, not universal statistical truths. They should be reviewed as economics and strategy change.
Beware of Thresholds Without Uncertainty
Suppose conversion rate falls from 4.1% to 3.9% and the dashboard turns red because the target is 4.0%. Should management react immediately? Maybe not.
If the metric is based on only 100 sessions, random variation could be substantial. If it is based on 2 million sessions, the interpretation may be different.
For decisions where sampling variability matters, useful context might include sample size, confidence intervals, control limits, credible intervals, or forecast intervals. Not every KPI card needs an interval displayed permanently, but the analytical system should not encourage users to treat every tiny movement as meaningful.
A Red KPI Does Not Explain Why It Changed
Suppose revenue falls 12%. The dashboard correctly alerts management. It does not prove the cause.
Revenue could decline because of lower traffic, lower conversion, lower average order value, product availability, pricing changes, seasonality, customer mix, campaign changes, or measurement errors.
A dashboard shows observed patterns. It does not automatically establish causal explanations. This distinction matters particularly when dashboards compare marketing channels. If Paid Search shows $500,000 in attributed revenue, that does not establish that Paid Search caused $500,000 of incremental revenue. Attribution assigns credit according to measurement rules; causal incrementality asks what would have happened without the marketing intervention.
More Filters Do Not Automatically Create More Insight
Interactive dashboards can be powerful, but every filter should answer a user need. Tableau notes that displayed interactive filters can generate additional queries, and excessive filters can slow dashboard rendering.
More importantly, filters also create cognitive choices. A dashboard with 14 filters, 11 charts, 8 KPI cards, and 5 tabs may technically offer enormous flexibility, but users still need to know where to look first. Expose the interactions necessary for the decision; keep the rest available through drill-down or secondary analysis.
Choose the Visualization After the Question
The visualization should follow the analytical task.
| Question | Useful starting visualization |
|---|---|
| How has revenue changed over time? | Line chart |
| Which region has the highest CAC? | Sorted bar chart |
| Are we above or below target? | KPI + variance / bullet-style comparison |
| How does performance vary across two dimensions? | Heatmap or matrix |
| What is driving a total? | Structured decomposition |
| What is the distribution? | Histogram / box plot |
Microsoft's Power BI guidance similarly advises choosing visualizations according to the data and comparison task rather than adding variety for its own sake. The question is not which chart looks impressive; it is which visual encoding makes the relevant comparison easiest to understand.
Dashboard Performance Is Part of Usability
A dashboard can be analytically correct and still fail if it takes too long to load. Performance can be affected by the number of views, marks, filters, calculations, queries, and underlying data sources.
Tableau explicitly treats performance as part of dashboard design rather than an afterthought. A smaller decision-focused dashboard can improve both cognitive and technical performance.
A Dashboard Governance Checklist
Before publishing a dashboard, document each primary KPI.
| Field | Example |
|---|---|
| KPI | Customer Acquisition Cost |
| Definition | Acquisition spend / new customers |
| Owner | VP Growth |
| Source | Marketing spend + customer table |
| Refresh | Daily |
| Target | ≤ $90 |
| Warning | $91–$105 |
| Investigation | > $105 |
| Primary decision | Whether to increase channel spend |
| Diagnostic path | Channel → campaign → landing page |
This documentation helps solve a problem that visualization alone cannot: metric governance. Two dashboards can display beautifully designed CAC cards while using different definitions of acquisition spend or new customer. If the metric definition is inconsistent, better visualization does not fix the underlying analytical problem.
The Dashboard Test
Before approving a dashboard, show it to the intended user and ask:
- What do you notice first?
- What decision would you make from this?
- What would make you investigate further?
- What information is missing for that decision?
- Which element would you remove if space were limited?
If users cannot answer those questions, adding more charts is unlikely to solve the problem.
Build Dashboards Backward From Decisions
A dashboard should not attempt to prove how much data an organization possesses. Its job is to compress complexity into useful decision evidence.
- Decision
- Business question
- Metric
- Comparison or threshold
- Action
- Diagnostic path
- Visualization
That sequence changes the role of BI. Instead of asking “What can we show?” the organization asks “What does someone need to know to make this decision well?” That is the difference between a dashboard that reports activity and a dashboard that supports decisions.
For a broader foundation, the KPI framework in business analytics article covers definitions, ownership, targets, and decision rules. The decision-thresholds discussion extends the question of when a signal should lead to action, while marketing attribution and incrementality explores the difference between assigned credit and causal business impact. Related dashboard work is also part of BI and data visualization consulting.
References / Further Reading
Is Your Dashboard Reporting Data—or Supporting Decisions?
UAD Consulting helps organizations define meaningful KPIs, structure analytical reporting, and design dashboards around the decisions users actually need to make.
Explore ServicesGet in Touch