BI & Data Visualization
Make performance easier to see and discuss with dashboards and visual analysis designed around the decisions your audience needs to make.
How This Service Helps
A dashboard is useful when it helps someone notice a meaningful change, understand its context, and decide what to do next. I work from that decision backward, clarifying the audience, measures, and level of detail before choosing a visual form.
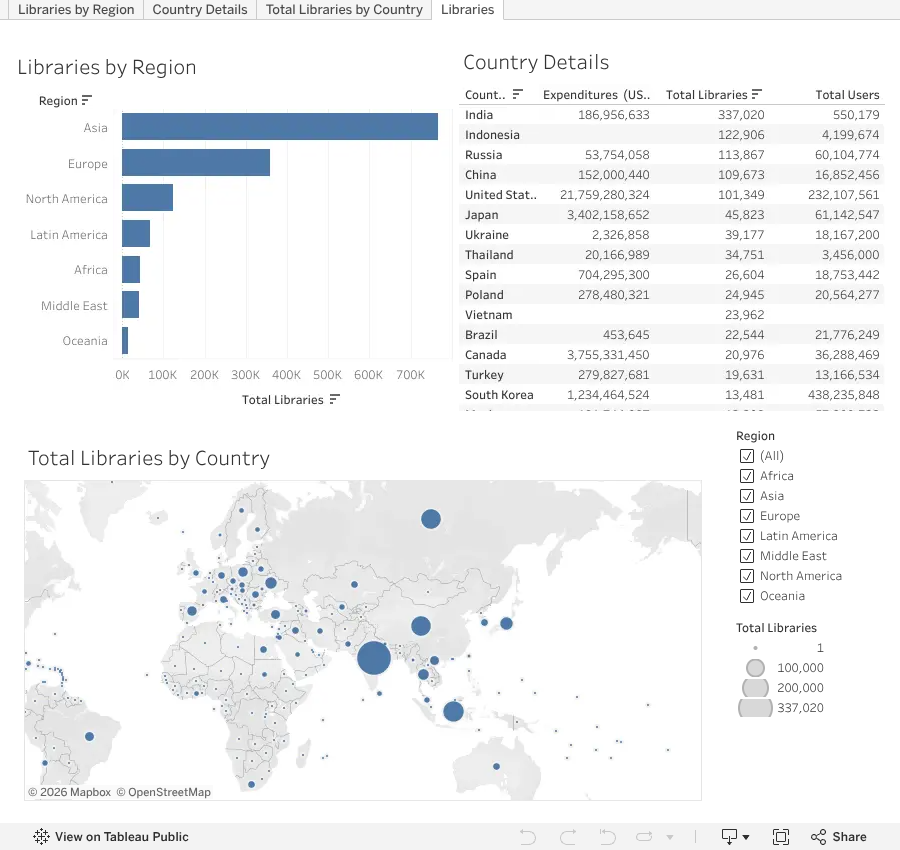
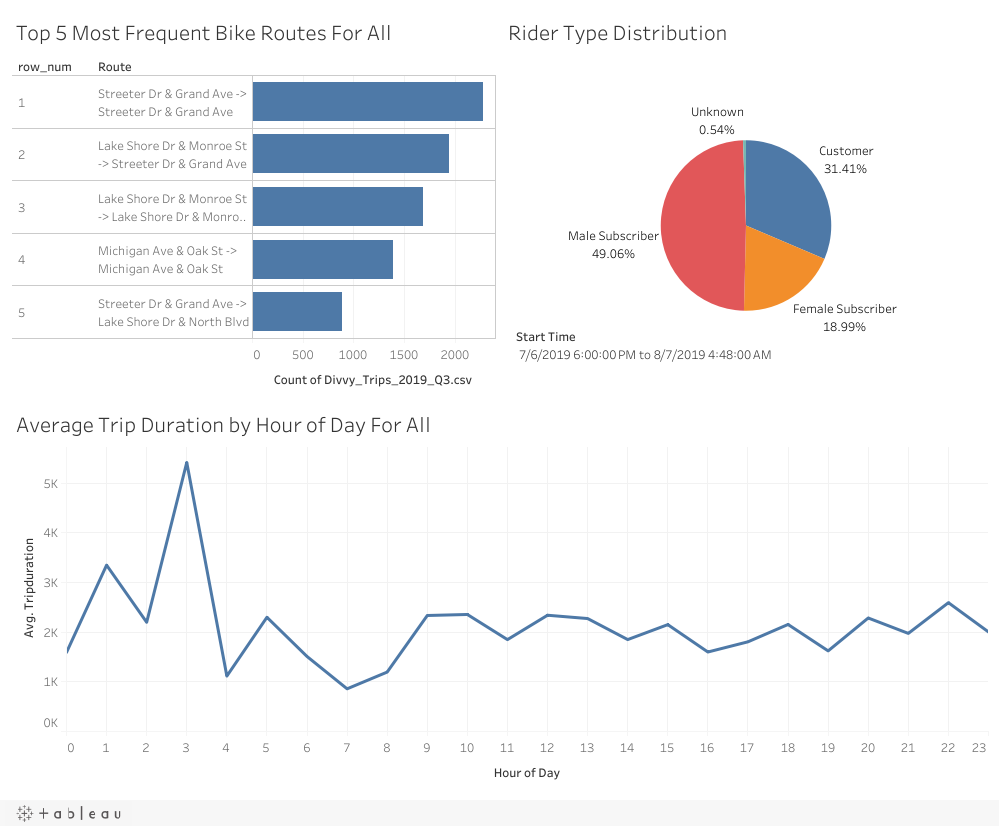
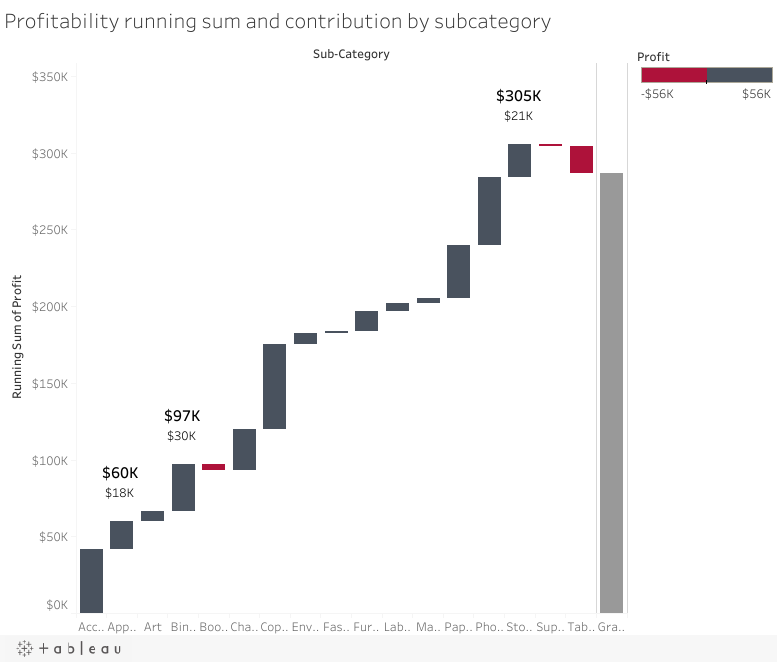
I can shape raw or modeled data into executive summaries, operational views, and exploratory visuals. That includes choosing appropriate charts, defining interactions, and documenting the logic behind important measures.
The outcome is a more consistent way to review performance, investigate exceptions, and communicate evidence across teams.
What I Can Help With
Questions This Work Can Help Answer
- Which measures should be visible to each audience?
- What is the clearest way to show change over time?
- Where should users be able to drill down?
- Why do two reports appear to show different numbers?
- How can a dashboard support a recurring decision or meeting?
How I Approach the Work
Start with the
business question.
Clarify the decision, available data, stakeholders, and what a useful outcome looks like.
Build the
evidence.
Prepare, explore, validate, and analyze the data using methods appropriate to the question.
Connect analysis
to the business.
Turn findings into clear implications, tradeoffs, and decision-relevant insights.
Make the work
usable.
Deliver the appropriate dashboard, report, model, analysis, or recommendation.
Tools & Methods
Have a similar analytics challenge?
Let's discuss the business question, available data, and what a useful analytical deliverable could look like.
Discuss Your Project