Global Library Analysis
An interactive Tableau analysis designed to explore global library data and transform a multidimensional dataset into an accessible visual decision-support experience.
The Challenge
Large datasets can contain meaningful patterns that are difficult to identify through tables or static reports alone. This project explores how an interactive business intelligence environment can make complex library data easier to investigate, compare, and understand.
The Approach
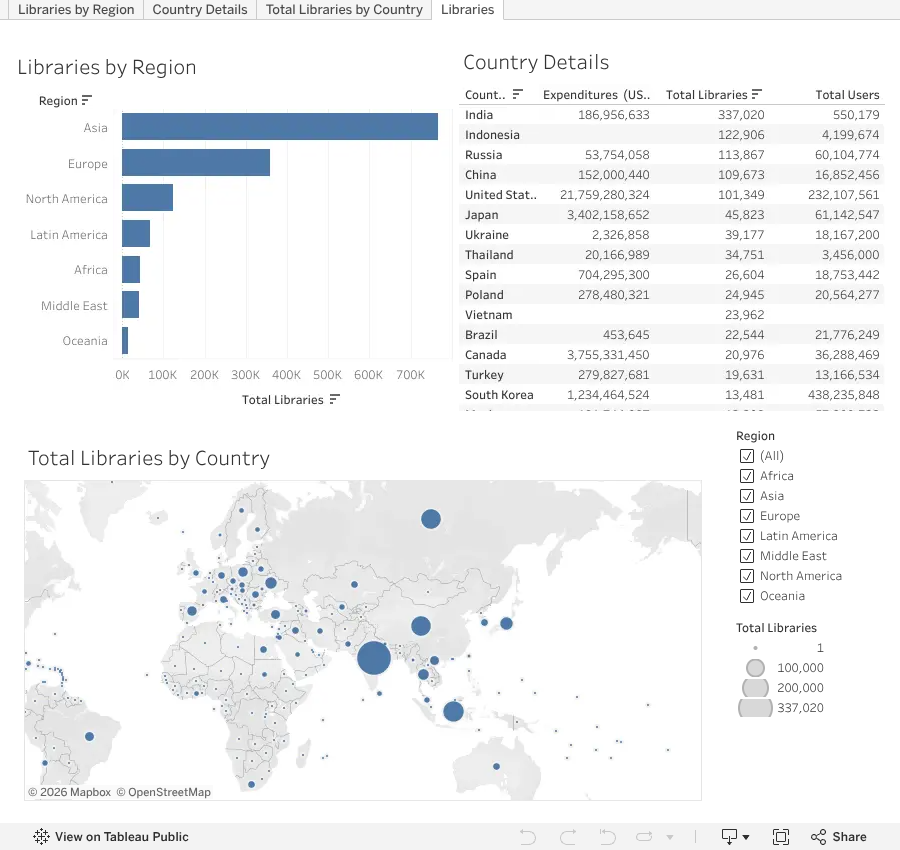
The dataset was organized into an interactive Tableau experience that allows users to explore the information visually rather than relying on a single static analysis. The dashboard emphasizes clear information hierarchy, comparative analysis, filtering, and exploratory data visualization.
Interactive Dashboard
Explore the dashboard below. Use the interactive controls, filters, and Tableau navigation to investigate the data from different perspectives.
What This Project Demonstrates
Interactive Data Exploration
Allows users to investigate the dataset dynamically rather than relying on a predefined static report.
Information Design
Organizes multiple dimensions and metrics into a visual structure designed for easier interpretation.
Business Intelligence
Demonstrates how Tableau can transform structured data into an interactive analytical environment.
Decision Support
Shows how visualization can help users identify patterns, comparisons, and relationships within complex datasets.
Tools & Methods
Want to See More Tableau Visualizations?
Explore additional dashboards and data visualization projects on my Tableau Public profile.
View Tableau Public Profile ↗