Chicago Bike-Share Ride Analysis
Exploring urban mobility patterns through interactive Tableau visualization.
This project analyzes Chicago bike-share trip data to identify patterns in rider behavior, route usage, and trip duration. The analysis transforms raw trip-level data into an interactive Tableau dashboard designed to make transportation patterns easier to explore and interpret.
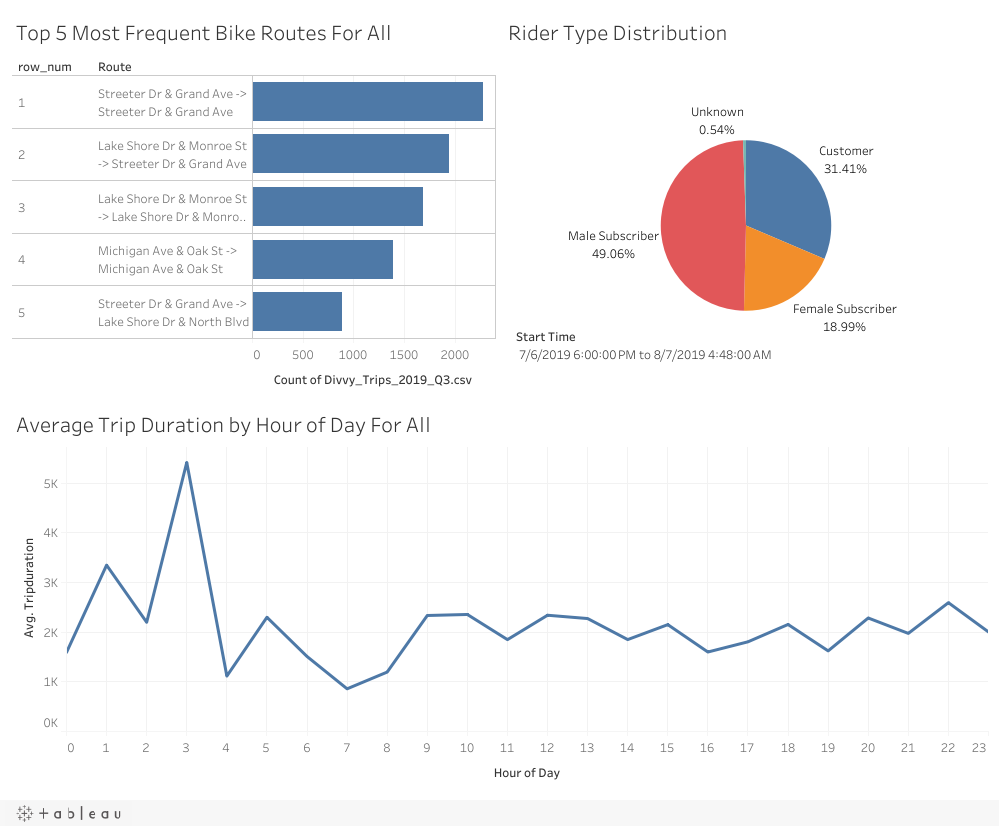
The dashboard focuses on three primary analytical questions: which bike routes are traveled most frequently, how ridership is distributed across rider types, and how average trip duration changes throughout the day.
Analysis
The dashboard combines multiple views to provide both behavioral and temporal perspectives on bike-share activity.
- Route Analysis — ranks the five most frequently traveled station-to-station routes, making it possible to identify high-traffic travel corridors.
- Rider Type Distribution — compares the composition of trips across subscriber/customer categories and demographic groupings available in the dataset.
- Hourly Trip Duration — examines how average trip duration varies by hour of day, highlighting differences in usage patterns across the daily cycle.
Interactive controls allow users to explore the underlying data directly rather than relying on a static set of charts.
Explore the Interactive Dashboard
Interact with the visualization below to explore rider composition, frequently traveled routes, and trip-duration patterns across different hours of the day.
Tools
Outcome
The final dashboard provides a compact view of Chicago bike-share activity by combining route frequency, rider composition, and temporal behavior. The project demonstrates how interactive visualization can turn trip-level transportation data into interpretable patterns that support exploratory analysis and operational understanding.