A company updates several important pages on its website.
The marketing team improves headings, rewrites descriptions, adds useful content, strengthens internal links, and corrects technical SEO issues.
Six weeks later, organic search clicks have increased by 40%.
Management is pleased.
The SEO project appears successful.
But there is an important question:
How much of that increase would have happened even if the company had made no changes?
Perhaps search demand increased across the industry.
Perhaps a competitor temporarily lost visibility.
Perhaps seasonal interest in the company's services increased.
Perhaps Google changed how results were displayed.
Or perhaps the SEO improvements genuinely contributed to the increase.
A simple before-and-after comparison cannot reliably distinguish these explanations.
To evaluate the impact of an SEO intervention, businesses need to think about the counterfactual: what would likely have happened without the intervention?
One potentially useful approach is difference-in-differences.
It is a statistical method designed to compare changes over time between groups exposed to an intervention and groups that were not.
When its assumptions are credible, difference-in-differences can support a more defensible estimate of incremental impact than a simple before-and-after comparison.
However, the method does not automatically establish causality.
Its usefulness depends on research design, comparison-group selection, data quality, and assumptions about what would have happened without the SEO changes.
The Short Answer: Traffic Growth Is Not Necessarily SEO Impact
Suppose a company updates ten service pages.
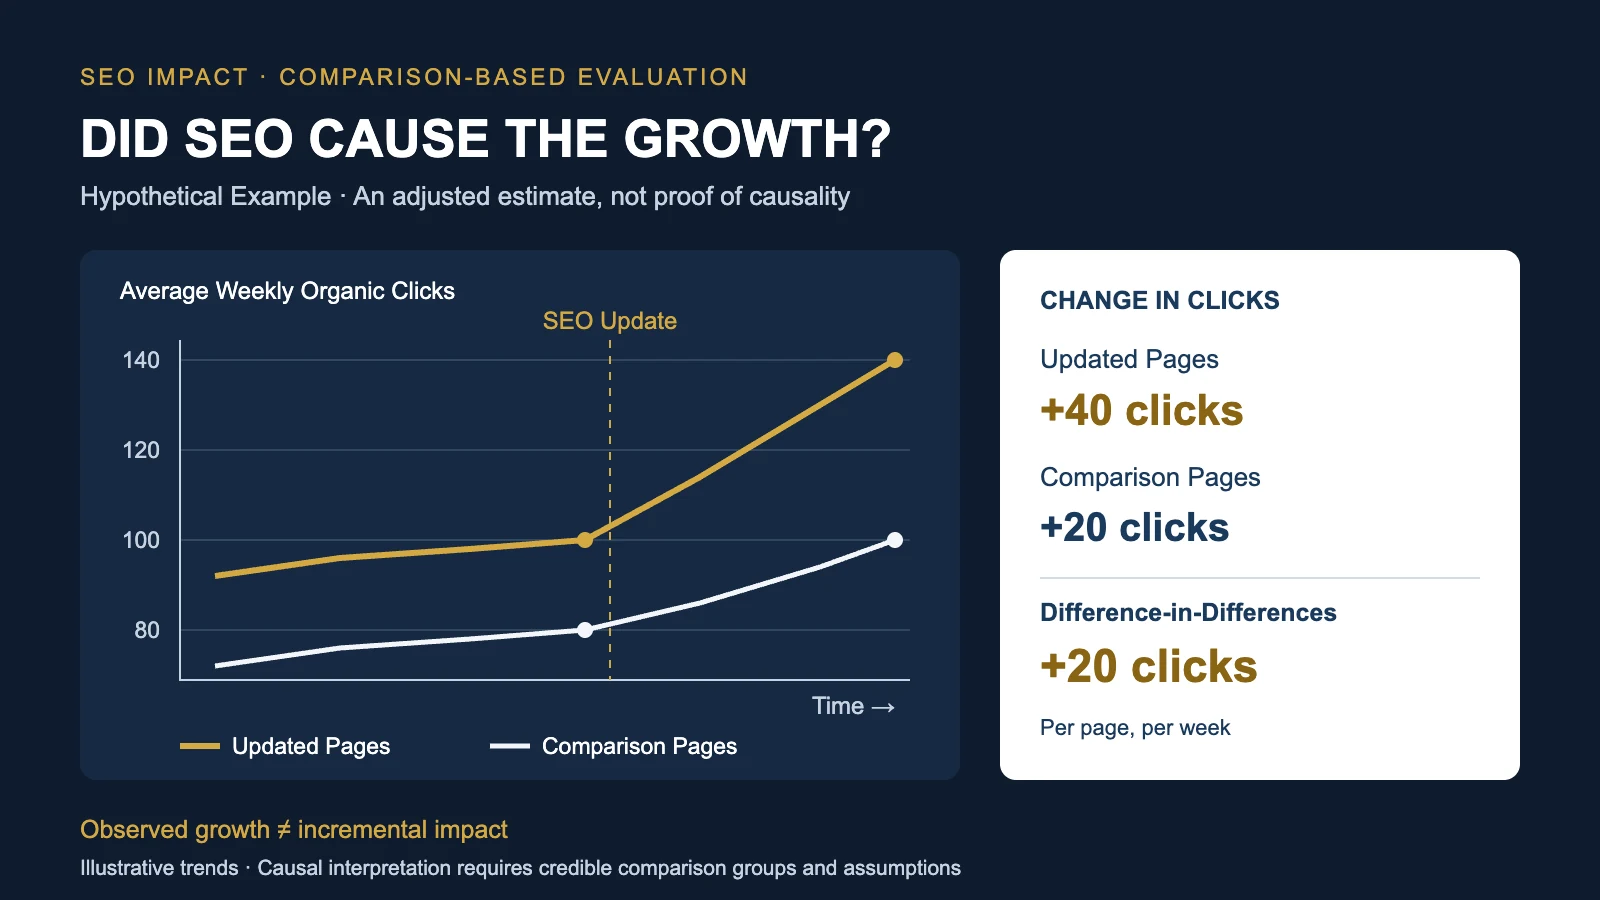
Before the update, these pages received an average of 100 organic clicks per page per week.
After the update, they receive 140.
The observed increase is:
140 - 100 = 40 clicks.
Percentage growth:
40 / 100 = 40%.
The company might report that the SEO changes generated 40% more organic traffic.
But this interpretation assumes the pages would otherwise have remained at 100 clicks.
That assumption may be incorrect.
Suppose ten comparable pages were not updated.
During the same period, their average weekly organic clicks increased from 80 to 100.
Those pages experienced:
100 - 80 = 20 additional clicks.
Their growth was:
20 / 80 = 25%.
Now the original 40-click increase looks different.
Some of the increase on the updated pages may reflect broader conditions that also affected the comparison pages.
A difference-in-differences calculation attempts to separate the observed change in the updated group from the change in the comparison group.
The result is not necessarily the true causal effect.
It is an estimate that can receive a causal interpretation only under appropriate assumptions.
What Is Difference-in-Differences?
Difference-in-differences, often abbreviated DiD, is a quasi-experimental method.
It compares two differences.
The first difference measures how the outcome changed in the group exposed to an intervention.
The second measures how the outcome changed in a comparison group that did not receive the intervention.
The second difference subtracts the comparison-group change from the treated-group change.
The basic formula is:
DiD = (Treated After - Treated Before) - (Control After - Control Before)
The intuition is straightforward.
If both groups were affected similarly by broader market conditions, the comparison group may help estimate how the treated group would have changed without the intervention.
For example, suppose seasonal search demand increased traffic across a category.
If updated and non-updated pages were similarly exposed to that seasonal increase, the comparison group could help account for it.
But this interpretation depends on a crucial assumption.
Without the intervention, the treated and comparison groups would have followed parallel trends in their outcomes.
That assumption cannot be verified simply by observing that the groups have similar average traffic levels.
It requires careful consideration of their historical behavior and the forces affecting them.
A Worked Example: Evaluating an SEO Content Update
Consider a hypothetical professional services company.
It has twenty established service and informational pages.
Ten pages receive an SEO improvement package.
The other ten remain unchanged during the evaluation period.
The intervention includes:
Revised page titles.
Improved heading structure.
Expanded explanatory content.
More relevant internal links.
Technical corrections affecting the selected pages.
The company wants to know whether these changes increased organic search clicks.
The outcome is defined as:
Average weekly Google Search Console clicks per page.
The company uses comparable observation windows before and after the intervention.
The results are:
| Page Group | Before | After | Change |
|---|---|---|---|
| Updated pages | 100 | 140 | +40 |
| Comparison pages | 80 | 100 | +20 |
All values are hypothetical.
They are not UAD Consulting performance results or client data.
The figures represent group averages, not total site traffic.
Each group contains ten pages.
The comparison assumes a consistent page population and measurement definition.
Step 1: Calculate the Change in Updated Pages
The updated pages increased from 100 to 140 average weekly clicks per page.
The observed change is:
140 - 100 = 40.
That is an increase of 40 clicks per page per week.
The percentage increase is:
40 / 100 = 40%.
This is a descriptive result.
It establishes that clicks increased after the SEO update.
It does not establish why.
Step 2: Calculate the Change in Comparison Pages
The comparison pages increased from 80 to 100 average weekly clicks per page.
Their observed change is:
100 - 80 = 20.
That is an increase of 20 clicks per page per week.
These pages did not receive the targeted SEO changes.
However, their performance may still have been influenced by external factors.
Examples include:
Changes in search demand.
Industry seasonality.
Competitor activity.
Search-result interface changes.
Algorithm updates.
Broader changes in user behavior.
The comparison-group change provides information about what happened in the same environment without the targeted intervention.
It is not automatically a perfect estimate of the counterfactual.
Step 3: Calculate Difference-in-Differences
Subtract the comparison-group change from the treated-group change.
DiD = 40 - 20.
DiD = 20.
The difference-in-differences estimate is:
20 additional organic clicks per page per week.
Under the identifying assumptions, this is the estimated average incremental effect of the SEO intervention on the treated pages.
Because ten pages were updated, the corresponding aggregate estimate would be:
10 × 20 = 200 additional clicks per week.
This aggregate calculation assumes the page-level average is representative of all ten treated pages.
It also assumes the same measurement period and a consistent set of treated pages.
The estimate is conditional on the research design.
It is not proof that exactly 200 additional clicks were caused by the intervention.
Step 4: Construct the Counterfactual
The counterfactual is the outcome the treated pages would have experienced without the SEO changes.
That outcome cannot be directly observed.
The difference-in-differences method estimates it using the comparison-group change.
Before the intervention, updated pages averaged 100 clicks.
The comparison group increased by 20 clicks.
If the treated pages would have experienced the same absolute change without the intervention, their estimated counterfactual outcome would be:
100 + 20 = 120.
The observed post-intervention outcome was:
140.
Therefore:
Observed outcome - Estimated counterfactual
= 140 - 120
= 20.
The estimated incremental difference is 20 clicks per page per week.
This can also be expressed relative to the estimated counterfactual:
20 / 120 = 16.7%.
Under the stated assumptions, the estimated increase relative to the counterfactual is approximately 16.7%.
This is different from the observed 40% before-and-after growth.
It is important not to confuse these two percentages.
The 40% figure describes observed growth relative to the treated group's original level.
The 16.7% figure describes the DiD estimate relative to the estimated counterfactual post-intervention level.
Neither percentage establishes causal certainty by itself.
The Critical Assumption: Parallel Trends
Difference-in-differences depends heavily on the parallel-trends assumption.
The assumption concerns the outcomes that would have occurred without treatment.
In the absence of the SEO intervention, the treated and comparison groups must have experienced the same expected change in the outcome over the evaluation period, for the simple additive DiD estimator to identify the intended effect.
This does not require the groups to have identical traffic levels.
One group may consistently receive more clicks.
What matters is whether their untreated trends would have moved similarly.
Consider two groups of pages.
Before the intervention, the treated pages consistently receive about 20 more clicks per week than the comparison pages.
Both groups experience similar increases over time.
That pattern may make the comparison more plausible.
Now consider a different situation.
The treated pages have been growing rapidly for several months.
The comparison pages have remained relatively flat.
If those different trends would have continued without the intervention, subtracting the comparison-group change may exaggerate the estimated SEO effect.
A difference-in-differences calculation can be mathematically correct while its causal interpretation is invalid.
This is why research design matters more than simply applying the formula.
How Can You Evaluate Parallel Trends?
A useful starting point is to examine several periods before the SEO intervention.
For example, compare weekly organic clicks over eight or twelve weeks before the changes.
Plot the treated and comparison groups on the same timeline.
Look for:
Similar changes over time.
Major differences in seasonality.
Pre-existing acceleration or decline.
Sudden structural breaks.
Unusual volatility.
Differences associated with page type or search intent.
The objective is not necessarily to find identical lines.
It is to evaluate whether the groups appear to respond similarly to relevant conditions before treatment.
However, similar historical trends do not prove that parallel trends would have continued after treatment.
Conversely, a statistically insignificant pre-trend test does not prove the assumption holds.
Pre-trend tests can have limited statistical power.
A stronger analysis combines historical diagnostics with substantive knowledge about the pages, audiences, search queries, and intervention.
Sensitivity analysis should examine how conclusions change under plausible violations of the assumption.
Choosing Comparison Pages for an SEO Study
The comparison group is one of the most important design decisions.
A poor comparison group can make a sophisticated statistical analysis misleading.
Suppose the company updates pages about business analytics consulting.
It then uses unrelated pages about seasonal consumer products as controls.
These pages may face very different demand patterns.
Their audiences may differ.
Their search queries may differ.
Their competitive environments may differ.
The resulting comparison may not be credible.
A better approach is to identify pages with reasonably similar characteristics.
Potential matching dimensions include:
Page type.
Topic category.
Search intent.
Historical traffic patterns.
Historical growth rates.
Page age.
Content format.
Target geography.
Device mix.
Branded versus non-branded search exposure.
Seasonality.
The comparison pages should not have received the targeted intervention.
They should also be unlikely to receive substantial indirect effects from it.
Matching pages on observable characteristics can improve comparability.
But matching does not guarantee that unobserved factors are balanced.
SEO Creates a Special Problem: Spillover Effects
Unlike many controlled experiments, SEO interventions can affect more than the pages directly edited.
Suppose a company improves internal linking.
Ten updated pages receive stronger links from the homepage and other important sections.
But those changes may also alter how search engines discover and interpret related pages.
Some supposedly untreated pages may benefit indirectly.
Others may lose internal-link prominence.
Similarly, an improvement to sitewide navigation, structured data templates, or technical infrastructure can affect large parts of the website.
This creates interference between treated and comparison units.
If comparison pages are indirectly affected by the intervention, their observed changes may no longer represent what would have happened without treatment.
The resulting DiD estimate can be biased.
For this reason, page-level difference-in-differences may be more credible for clearly localized content interventions than for broad sitewide SEO changes.
Even localized changes require checking for spillovers through internal linking, overlapping queries, and other shared mechanisms.
When the intervention affects the entire website, untreated pages on the same site may not provide a credible comparison group.
Alternative designs may be necessary.
Why Google Search Console Is Useful
Google Search Console provides several measures relevant to SEO performance evaluation.
These include:
Clicks.
Impressions.
Click-through rate.
Average position.
Performance by page.
Performance by query.
Performance by country.
Performance by device.
For a difference-in-differences study, organic clicks are often a useful primary outcome when the business question concerns traffic from Google Search.
However, the measurement definition must remain consistent.
A study should specify:
Search type.
Reporting dates.
Page identity.
Country filters.
Device filters.
Whether branded queries are included.
Whether the outcome is total clicks or average clicks per page.
Whether the analysis uses complete reporting periods.
These choices can materially affect the results.
Google Search Console's Search Analytics API supports grouping and filtering across several dimensions.
But it has reporting limitations.
The API does not guarantee every possible row will be returned.
When querying by date, days without reported data may be omitted.
Recent data may also be incomplete.
Therefore, analysts should not automatically interpret every missing API row as zero clicks.
A defensible dataset requires checking reporting coverage, query limitations, and whether the extraction method supports the intended page-level comparison.
Build a Consistent Page-Level Dataset
A useful analytical dataset can contain one row per page per week.
For example:
| Field | Meaning |
|---|---|
| page_id | Stable identifier for the page |
| week_start | Beginning of reporting week |
| organic_clicks | Google Search clicks for the defined scope |
| treated | Whether the page received the intervention |
| post_period | Whether the observation occurred after implementation |
| page_type | Service page, article, category page, etc. |
| topic_cluster | Subject area |
| intervention_date | Date the page was changed |
| device | Optional reporting segment |
| country | Optional reporting segment |
Page identity must be consistent.
If a page changes from an old URL to a new canonical URL during the study, traffic may be split or reassigned in reporting.
The analyst should establish how URL changes affect the measurement series.
Do not silently combine unrelated pages.
Do not treat redirects as proof that all historical Search Console reporting is perfectly comparable.
The study should also document whether the intervention changed the page's topic or search intent.
If a page was substantially rewritten to target a different audience, its pre- and post-intervention performance may represent different search markets.
That complicates interpretation.
A Simple SQL Framework
Assume a hypothetical PostgreSQL table named:
seo_page_weekly
Each row represents one page-week observation.
The table contains:
page_id
week_start
organic_clicks
treated
post_period
The following query calculates group-level average clicks and the basic difference-in-differences estimate.
WITH group_means AS (

    SELECT
        treated,
        post_period,
        AVG(organic_clicks::numeric) AS avg_clicks

    FROM seo_page_weekly

    GROUP BY
        treated,
        post_period

),

summary AS (

    SELECT

        MAX(avg_clicks) FILTER (
            WHERE treated = TRUE
              AND post_period = FALSE
        ) AS treated_before,

        MAX(avg_clicks) FILTER (
            WHERE treated = TRUE
              AND post_period = TRUE
        ) AS treated_after,

        MAX(avg_clicks) FILTER (
            WHERE treated = FALSE
              AND post_period = FALSE
        ) AS control_before,

        MAX(avg_clicks) FILTER (
            WHERE treated = FALSE
              AND post_period = TRUE
        ) AS control_after

    FROM group_means

)

SELECT

    treated_before,
    treated_after,
    control_before,
    control_after,

    (treated_after - treated_before)
    -
    (control_after - control_before)
        AS difference_in_differences

FROM summary;
For the hypothetical example, the expected result is:
20.
This query illustrates the calculation.
It does not establish that the design satisfies the assumptions required for causal inference.
It also assumes the input data have been prepared correctly.
For example:
Each page-week should appear at most once.
The page population should be stable.
Pre- and post-intervention windows should be comparable.
Missing observations should be investigated.
The treatment indicator should be defined consistently.
The intervention date should be documented.
The query uses PostgreSQL-style numeric casting and aggregate FILTER clauses.
Some other database systems may require different SQL.
Most importantly, this calculation does not produce a confidence interval or account for statistical dependence among observations.
Those requirements need additional modeling.
Why One Before-and-After Table Is Not Enough
A basic two-period table is useful for explaining the estimator.
But a real SEO evaluation should usually contain more observations.
Organic search performance varies over time.
Daily and weekly results can be influenced by:
Weekday patterns.
Seasonality.
Industry demand.
Competitor activity.
Search algorithm changes.
Search-result features.
Content publication schedules.
Marketing campaigns.
Technical website incidents.
With multiple weeks and pages, the analyst can examine the time pattern rather than relying on two averages.
The analysis may also estimate statistical uncertainty.
However, repeated observations from the same page are not independent.
Traffic from related pages may also move together.
A regression model that ignores this dependence can produce misleadingly narrow confidence intervals.
Inference methods should reflect the unit of treatment assignment, serial dependence, common shocks, and the number of independent units available.
With only a small number of treated or comparison pages, conventional large-sample approximations may be unreliable.
A reported point estimate should not be presented as statistically significant without appropriate uncertainty analysis.
A Difference-in-Differences Regression
The basic two-group, two-period design can be represented using a regression model.
Let:
Y_it = Organic clicks for page i at time t.
Treated_i = 1 for updated pages.
Post_t = 1 for observations after the intervention.
A simple specification is:
Y_it = β0 + β1 Treated_i + β2 Post_t + β3 (Treated_i × Post_t) + ε_it
The interaction coefficient β3 corresponds to the difference-in-differences estimate in the simple two-by-two design.
In the hypothetical example:
β3 = 20.
This is the estimated additional change in weekly clicks per page for the updated group relative to the comparison group.
A regression does not automatically solve the identification problem.
If parallel trends are implausible, the coefficient may not have a credible causal interpretation.
Adding more variables also does not automatically eliminate bias.
The model must reflect a defensible research design.
Five Threats to a Credible SEO Impact Estimate
1. Different underlying trends
Updated pages may already have been growing faster than comparison pages.
If that growth would have continued, the DiD estimate may attribute existing momentum to the intervention.
2. Simultaneous marketing changes
The company may launch advertising campaigns, email promotions, or public relations initiatives at the same time.
These activities can influence search behavior.
If they affect the groups differently, the comparison may be confounded.
3. Search algorithm and interface changes
Search engines can change ranking systems, result layouts, and visibility opportunities.
These changes may affect topics or page types differently.
A comparison group does not automatically remove such effects.
4. Page selection bias
The marketing team may select pages for improvement because they have recently declined.
Some of those pages might rebound even without intervention.
Alternatively, the team may select pages already showing strong growth.
Either situation can distort a naive before-and-after interpretation.
5. Measurement changes
Redirects, canonical changes, URL migrations, reporting filters, and incomplete data can alter the measured outcome.
An apparent traffic change may partly reflect a change in how performance is recorded.
These threats should be documented before management interprets the estimate as incremental SEO impact.
Can Difference-in-Differences Prove SEO Caused the Increase?
Not automatically.
Difference-in-differences is a causal inference method under a set of identifying assumptions.
Those assumptions include a credible untreated counterfactual trend.
The study must also consider interference, anticipatory behavior, changing group composition, and other interventions that may affect the outcome.
If these assumptions are not credible, the calculation remains a descriptive adjusted comparison.
That can still be useful.
It may show that updated pages improved more than a selected comparison group.
But it should not be described as a proven causal effect.
This distinction matters because marketing reports often move too quickly from observed performance to causal claims.
An increase in clicks after an SEO update establishes temporal association.
A difference-in-differences estimate adjusts that association using a comparison group.
A credible causal interpretation requires additional justification.
For a broader explanation of this distinction, see UAD Consulting's article on Marketing Attribution vs. Incrementality.
What If the SEO Changes Were Rolled Out Gradually?
Suppose a company updates ten pages in September, another ten in October, and another ten in November.
This is a staggered intervention.
A simple two-period comparison may no longer be appropriate.
Different pages receive treatment at different times.
The effect may also vary by page and by time since the update.
In such settings, conventional two-way fixed-effects difference-in-differences models can produce difficult-to-interpret estimates when treatment effects are heterogeneous.
Modern staggered-adoption methods can address these issues more carefully.
The analysis should distinguish pages that have not yet been treated from pages already exposed to the intervention.
It should also examine how effects evolve after implementation.
A company should not assume that adding page and week fixed effects automatically makes a staggered SEO rollout causally valid.
The estimation method must match the treatment timing and intended effect.
When Is Difference-in-Differences Not the Right Method?
Difference-in-differences is not suitable for every SEO project.
It may be especially difficult to justify when:
The entire website changes simultaneously.
There are no credible comparison pages.
The website is very new.
Historical performance is extremely sparse.
Treated and comparison pages have different pre-existing trends.
The intervention affects untreated pages.
Major unrelated changes occur at the same time.
Search demand differs substantially across groups.
Measurement definitions change during the evaluation.
In these situations, other approaches may be more useful.
For example:
A randomized page-level rollout may be possible when pages can be assigned to treatment and control groups without substantial interference.
An interrupted time-series analysis may help characterize changes over time, although it remains vulnerable to coincident events without a credible counterfactual.
Synthetic-control methods may help construct a comparison from multiple candidate units when sufficient historical data exist.
A descriptive monitoring framework may be the most defensible option when the data cannot support credible causal identification.
The correct choice depends on the decision, the available data, and the intervention.
More complicated statistics do not compensate for an unsuitable research design.
Search Clicks Are Not the Same as Business Value
Even if an SEO intervention increases organic clicks, the company still needs to determine whether those visits create meaningful business outcomes.
Additional clicks may produce:
More qualified leads.
More consultation requests.
More purchases.
More newsletter subscriptions.
More product inquiries.
Or very little measurable commercial activity.
The relationship depends on search intent, landing-page relevance, conversion experience, and the business model.
Google Search Console clicks are also not identical to sessions recorded in GA4.
The systems use different measurement rules and data-collection processes.
They should not be treated as interchangeable.
A useful SEO evaluation separates:
Search visibility.
Organic clicks.
Website engagement.
Conversions.
Qualified opportunities.
Revenue.
Profitability.
An SEO intervention can improve one stage without improving every subsequent stage.
For related measurement principles, see How Do You Measure AI Search Visibility?
That article discusses visibility and downstream business outcomes.
The present article focuses specifically on estimating the incremental effect of a defined SEO intervention.
A Practical SEO Evaluation Framework
Businesses can organize an SEO impact study around eight questions.
1. What exactly changed?
Document the intervention.
Was it a title update?
A content rewrite?
An internal-linking change?
A technical correction?
A complete redesign?
Avoid treating a bundle of unrelated changes as one precisely identified mechanism.
If several changes are implemented together, the analysis may estimate the effect of the package rather than the effect of each component.
2. Which pages were affected?
Define the treatment group before examining post-intervention performance.
Avoid selecting pages after observing which ones improved.
3. What is the primary outcome?
Choose a clearly defined measure.
For example:
Average weekly organic clicks per page.
Do not switch between clicks, impressions, sessions, and conversions depending on which metric shows the largest improvement.
4. What is the comparison group?
Identify pages that were not directly treated.
Evaluate their similarity to the treated pages.
Examine potential spillovers.
5. Are the pre-intervention trends credible?
Review multiple historical periods.
Investigate structural differences.
Do not interpret a non-significant pre-trend test as proof that the identifying assumption holds.
6. Were other changes occurring?
Document major campaigns, website releases, migrations, and relevant external events.
Assess whether they affected the groups differently.
7. How uncertain is the estimate?
Report uncertainty when the data and design support it.
Consider dependence across pages and time.
Use sensitivity analysis to examine alternative comparison groups and plausible departures from parallel trends.
8. What decision will the result support?
The objective may be to determine whether to:
Expand an SEO intervention.
Revise the content strategy.
Invest in technical improvements.
Conduct a stronger experiment.
Continue monitoring.
Or stop an ineffective activity.
The evaluation should support a real decision rather than merely produce an attractive performance number.
Frequently Asked Questions
How do I know whether SEO changes caused more traffic?
A before-and-after increase is not sufficient evidence of causality.
A credible experiment or carefully designed quasi-experimental study can provide stronger evidence.
Difference-in-differences is one option when an appropriate comparison group and identifying assumptions are available.
What is difference-in-differences in SEO?
It compares the change in organic search performance for updated pages with the change for comparable pages that were not updated.
The difference between those changes is the DiD estimate.
Can Google Search Console prove SEO incrementality?
No.
Search Console provides observed search performance data.
It does not independently establish what would have happened without an SEO intervention.
Causal evaluation requires an appropriate research design.
Do treatment and control pages need identical traffic?
No.
The basic DiD assumption concerns how the untreated outcomes would have changed over time.
The groups do not need identical starting levels.
However, different baseline levels may signal other differences that deserve investigation.
Is a 40% increase after an SEO update a 40% causal lift?
Not necessarily.
The observed increase may include changes that would have occurred without the intervention.
A credible counterfactual is needed to estimate incremental impact.
Can I use difference-in-differences for a complete website redesign?
Possibly, but identifying a credible untreated comparison may be difficult.
If the entire website changes, pages within that site may all be affected.
Alternative research designs may be more appropriate.
Better SEO Measurement Starts With the Counterfactual
Return to the original example.
The company updated ten pages.
Average weekly clicks increased from 100 to 140 per page.
The observed increase was 40%.
But comparable pages also improved.
Their average weekly clicks increased from 80 to 100.
The difference-in-differences estimate was therefore:
20 additional clicks per page per week.
Under the assumed parallel counterfactual trends and other identifying conditions, that corresponds to an estimated incremental increase of approximately 16.7% relative to the treated group's counterfactual post-intervention level.
The example does not prove that SEO changes generally produce this result.
All numbers are hypothetical.
The calculation illustrates why a comparison group can materially change the interpretation of observed performance.
The broader lesson is that analytics should distinguish three questions.
What happened?
What would likely have happened without the intervention?
What evidence supports the difference between those outcomes?
Traditional reporting often answers the first question.
Causal inference attempts to address the second and third.
For businesses investing in SEO, that distinction can lead to more defensible decisions about which improvements deserve additional time, attention, and resources.
References and Further Reading
- World Bank Development Impact Evaluation (DIME). Difference-in-Differences. DIME Wiki.
- Google Search Central. A deep dive into Search Console performance data filtering and limits. October 19, 2022.
- Google Search Console API. Search Analytics: Query. Official API documentation. Updated August 11, 2026.
- Roth, Jonathan. Pretest with Caution: Event-Study Estimates after Testing for Parallel Trends. American Economic Review: Insights. 2022;4(3):305–322. DOI: 10.1257/aeri.20210236.
- Freedman, Seth M., Alex Hollingsworth, Kosali I. Simon, Coady Wing, and Madeline Yozwiak. Designing Difference in Difference Studies With Staggered Treatment Adoption: Key Concepts and Practical Guidelines. NBER Working Paper 31842. November 2023. DOI: 10.3386/w31842.
All numerical examples are hypothetical. No private client data or actual SEO performance results are used.
Evaluate SEO Performance With Better Evidence
An SEO project should not be judged solely by whether traffic increased after implementation.
A stronger evaluation connects search performance, measurement quality, comparison groups, statistical assumptions, and business outcomes.
UAD Consulting helps organizations evaluate digital performance through analytics, data preparation, search measurement, and decision-focused research.
Whether the question involves technical SEO, content performance, organic traffic growth, or marketing effectiveness, the objective is to understand what the evidence supports and where uncertainty remains.
Explore our SEO & AI Search Analytics services to discuss your measurement challenges.
Explore ServicesGet in Touch