A company publishes a detailed guide. A few weeks later, someone discovers the company through an AI-generated answer. What should the marketing team record: an impression, a citation, a referral visit, or a lead? And if revenue later increases, how much should be credited to AI search?
These are practical measurement problems. Search discovery is no longer limited to a conventional results page followed by a click. Content can be retrieved, summarized, cited, compared, or used to ground an answer before a user visits the source website.
The useful question is not “What is our AI-search KPI?” It is “At which stages can we observe AI-search visibility, and what can each measurement legitimately tell us?”
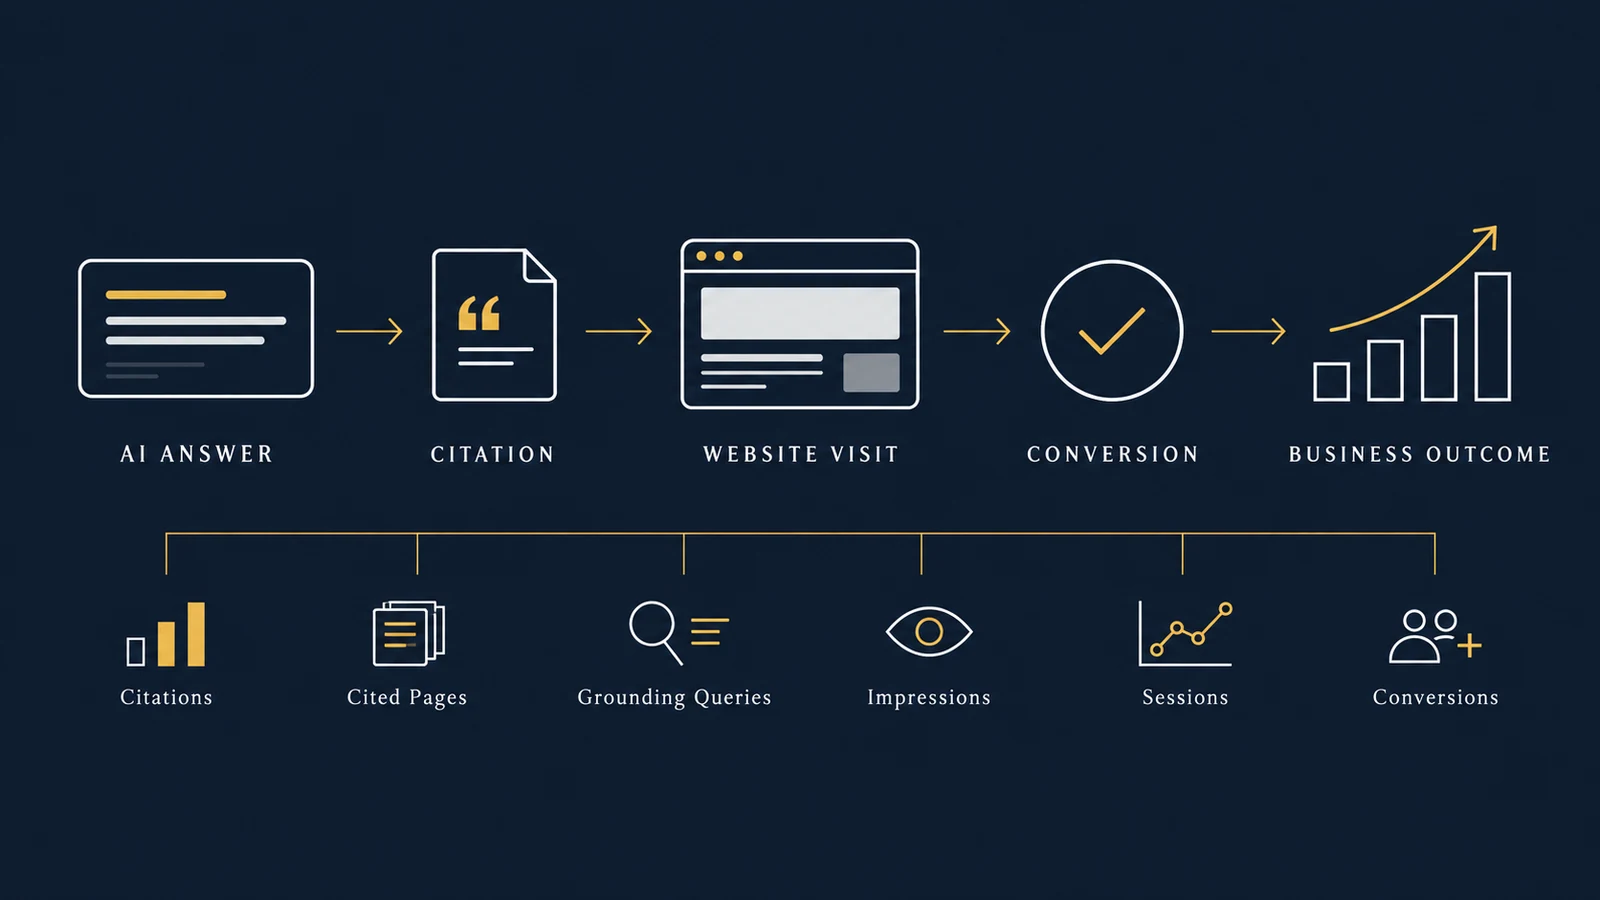
Discovery → Citation → Visit → Conversion → Business Outcome
Each stage answers a different question. None, by itself, proves that AI search caused the final business result.
AI Search Visibility Is a Measurement Chain
Traditional SEO reporting often centers on impressions, rankings or average position, clicks, click-through rate, organic sessions, and conversions. AI-generated search experiences complicate that sequence: a page can contribute to an answer without a click, a source can be cited more than once, and the retrieval phrase may differ from the user's wording.
| Stage | Business question | Example measures |
|---|---|---|
| Discovery | Can content be found and surfaced? | Indexable URLs, search impressions, query/topic coverage |
| Citation | Is content referenced in AI answers? | Citations, cited pages, grounding queries, citation share |
| Visit | Does visibility produce site traffic? | AI referral sessions, landing pages, engaged sessions |
| Conversion | Do visits complete useful actions? | Leads, consultations, sign-ups, purchases |
| Outcome | Is there measurable business value? | Qualified pipeline, revenue, retention, cost savings |
A change at one stage does not automatically imply a change at the next.
Stage 1: Measure Discoverability Before AI Visibility
An AI system cannot reliably surface a page it cannot discover or retrieve. Begin with indexability, canonical consistency, crawl status, sitemap coverage, internal links, HTTP status, robots directives, and content freshness where relevant. These are prerequisites rather than AI-specific performance metrics.
For example, if an article is available at /analysis.html, /analysis, and /analysis?source=blog while canonical signals conflict, analytics may split one page identity across several URLs. Establish one canonical public URL consistently across canonical metadata, sitemap entries, internal links, structured data, and reporting. For a deeper technical discussion, see URL parameters and canonicalization.
Stage 2: Measure Citations Separately From Rankings
A citation is an observable event distinct from a conventional ranking. In February 2026, Microsoft introduced AI Performance reporting in Bing Webmaster Tools. Its reported measures include total citations, average cited pages, grounding queries, and page-level citation activity. Microsoft explains that citation counts show how often content appears as a source in supported AI experiences; they do not indicate placement or the role of a page within an answer (Microsoft Bing Webmaster Blog, AI Performance public preview).
In June 2026, Microsoft added preview reporting for intents, topics, Citation Share, and period comparison. Citation Share is described as an observational measure of citation presence for a grounding query, not a ranking system or competitive scoreboard (Microsoft Bing, AI visibility insights).
Suppose an article receives 120 citations in a reporting period. That is evidence it appeared as a source in experiences captured by the reporting system. It does not mean 120 people visited, read the article, saw it first, converted, or generated revenue because of it. Citation count is a visibility measure, not a complete performance measure.
A Better Citation Dashboard
The following hypothetical values illustrate why citation counts should be reported beside, not instead of, downstream activity.
| Page | Citations | Grounding queries | AI referral sessions | Conversions |
|---|---|---|---|---|
| Pricing Guide | 180 | 42 | 95 | 8 |
| Technical Guide | 145 | 67 | 34 | 2 |
| Comparison Article | 110 | 31 | 120 | 11 |
| Research Report | 80 | 54 | 18 | 1 |
| Service Guide | 45 | 12 | 70 | 9 |
The Technical Guide has more citations than the Comparison Article, but fewer observed visits and conversions. A research page may build topical visibility; a comparison page may bring commercial visits; a service page may convert a smaller audience. Preserve those distinctions rather than forcing every page into one leaderboard.
Stage 3: Grounding Queries Reveal Retrieval Context
Microsoft describes grounding queries as phrases used by an AI system when retrieving content that is referenced in generated answers. A page titled “Marketing Attribution vs. Incrementality” may be retrieved for phrases about measuring marketing lift, incremental conversions, causal marketing measurement, or channel effectiveness. Query context can reveal concepts associated with a page, but it is not equivalent to a traditional keyword ranking.
Individual strings can be noisy. “How to measure marketing lift,” “did ads cause sales,” and “incremental impact of advertising” could be grouped into an internal topic such as incremental marketing impact. Microsoft's June 2026 preview added topic and intent groupings to help publishers inspect broader patterns. Treat those groupings as reporting classifications, not as a definitive map of user intent.
| Topic cluster | Example intent |
|---|---|
| Attribution | Which channel receives credit? |
| Incrementality | Did marketing create additional outcomes? |
| Marketing mix modeling | How should budget be allocated? |
| CAC and LTV | Are acquired customers economically valuable? |
| Measurement infrastructure | Can the required data be trusted? |
Stage 4: Measure AI Referral Traffic, but Know Its Limits
Where referral information is available, analytics can identify sessions arriving from known AI or search-assistant sources. A report might track sessions, users, landing pages, engagement, consultation requests, sign-ups, or purchases.
For example, 36 consultation requests from 1,200 identified AI referral sessions produce an observed session-to-consultation rate of 36 / 1,200 = 3%. That describes conversion behavior among recorded sessions. It does not capture everyone who saw a brand in an answer: some may return later through direct traffic or branded search, use another device, or never visit.
A team might also monitor sessions divided by citations as a descriptive internal ratio. But citation counts and referral sessions may cover different populations and exposure definitions. A citation is not necessarily a user impression, so sessions per citation should not automatically be called a search-result click-through rate.
For example, 500 citations and 100 identified referral sessions yield 100 / 500 = 0.20 observed sessions per citation, or 20 sessions per 100 citations. This may be useful for directional monitoring if definitions stay stable, but the numerator and denominator are not necessarily the same exposure universe.
Stage 5: Connect Visits to Conversions
Traffic is not the final objective for most businesses. Consider these hypothetical topic-cluster results:
| Cluster | AI referral sessions | Leads | Observed lead rate |
|---|---|---|---|
| Educational Analytics | 800 | 16 | 2.0% |
| Decision Analytics | 300 | 18 | 6.0% |
The educational cluster brings more traffic while the decision-oriented cluster produces more leads. Neither is universally better; they may play different roles in a content strategy. Report visibility and business measures together, while keeping their meanings separate.
Stage 6: Measure Business Outcomes Without Overclaiming Attribution
If identified AI referral sessions are associated with 50 leads, 10 sales, and $100,000 in recorded revenue, the organization can state that the revenue was associated with customers whose recorded acquisition session came from an identified AI referral source under a specified attribution rule. That is an attribution statement, not necessarily a causal one. Customers may also have encountered advertising, email, earlier search, referrals, or offline recommendations. See marketing attribution and incrementality for the distinction between assigned credit and incremental impact.
Make the attribution definition visible in the report. “Revenue associated with recorded AI referral sessions under our last-touch rule” is more precise than “revenue generated by AI search.” The wording communicates what was observed without suggesting that unobserved influence or counterfactual impact has been measured.
Likewise, if citations rise from 200 to 400 while revenue rises from $80,000 to $100,000, the two metrics increased in the same period. Advertising, seasonality, pricing, product availability, sales staffing, conversion rates, and market demand could also have changed. The observation does not establish that citation growth caused revenue growth.
Build a Metric Hierarchy
1. Technical eligibility
Examples: indexable pages, canonical consistency, sitemap coverage, crawl errors, and structured-data validity. Question: can content reliably participate in retrieval?
2. Search and AI visibility
Examples: search impressions, cited pages, citations, grounding queries, topics, intents, and Citation Share where available. Question: where and how is content being surfaced?
3. Website response
Examples: referral sessions, engaged sessions, landing-page engagement, and return visits. Question: does visibility produce observable site activity?
4. Conversion
Examples: form submissions, consultation bookings, registrations, and purchases. Question: do visits produce meaningful actions?
5. Business outcome
Examples: qualified leads, sales pipeline, revenue, retention, and cost savings. Question: what outcomes are associated with the channel under a defined measurement model?
6. Causal evidence
Examples: randomized experiments, geographic experiments, controlled holdouts, or carefully designed quasi-experiments. Question: did an intervention cause incremental outcomes? This final layer cannot be inferred from the preceding layers alone.
An Example Executive Scorecard
- Technical: 42 of 44 authority pages indexed
- Visibility: 18 AI-cited pages, 640 citations, 9 tracked topic clusters
- Traffic: 420 identified AI referral sessions
- Conversion: 21 consultation requests, or 5.0% of recorded sessions
- Commercial: 7 qualified opportunities associated with those sessions
Interpretation: citation visibility and identifiable referral activity increased during the period. These are observational channel measures; this scorecard does not claim citation growth caused the associated commercial outcomes.
Measure Topic Coverage and Cited-Page Breadth
A site could double its citations while becoming dependent on one subject. Topic distribution can make that concentration visible as an internal content-portfolio measure.
| Topic | Citations | Share |
|---|---|---|
| Marketing Measurement | 350 | 35% |
| Business Analytics | 250 | 25% |
| Data Engineering | 180 | 18% |
| Decision Analytics | 120 | 12% |
| Healthcare Analytics | 100 | 10% |
Another measure is the number of distinct pages cited. For example, 500 citations across five pages and 600 across 20 pages describe different breadth patterns. Neither breadth nor total count automatically represents authority or ranking; these are visibility characteristics useful for questions about content coverage.
Where the reporting system offers intent classifications, use them as another descriptive cut. Informational, commercial, navigational, research, or problem-solving groupings can help teams examine the context around cited content. Treat labels as system-generated classifications that may evolve, not as ground truth about every user's intent.
Freshness Is a Measurement Variable Too
Track publication dates, true substantive update dates, crawl or inspection status, indexing status, and citation activity after updates. Microsoft recommends accurate sitemap modification dates and describes IndexNow as a complement for notifying participating search engines when URLs change. Neither a sitemap nor IndexNow guarantees citation or inclusion. Microsoft's sitemap guidance emphasizes keeping these signals accurate rather than changing dates merely because a sitemap was regenerated.
Do Not Optimize Blindly for Citation Count
Once a metric becomes visible, organizations tend to optimize it. If teams are rewarded only for citation totals, they may publish shallow content around easy informational queries while brand differentiation, commercial relevance, lead quality, or maintenance quality declines. A measure becomes dangerous when it replaces the objective it was intended to represent. AI citation activity belongs inside a broader business measurement system.
A Practical Monthly Workflow
- Verify technical identity: inspect canonical URLs, sitemap presence, indexability, status codes, structured data, and internal links.
- Collect available visibility data: search impressions, citations, cited pages, grounding queries, topics, intents, and citation-share measures.
- Normalize URLs: avoid fragmentation across www/non-www, HTTP/HTTPS, .html/extensionless, and parameterized variants.
- Join visibility data to web analytics: connect at an intentional landing-page grain with sessions and conversions; do not treat the join as causal evidence.
- Group into strategic topics: map pages and retrieval phrases to categories relevant to the business.
- Interpret by measurement layer: report eligibility, visibility, visits, conversions, outcomes, and causal evidence separately.
A Simple Data Model
A practical reporting table could use one row per page per day:
| Date | Page | Topic | Citations | Search impressions | AI referral sessions | Conversions |
|---|---|---|---|---|---|---|
| 2026-10-01 | /guide-a | Attribution | 14 | 520 | 8 | 1 |
| 2026-10-01 | /guide-b | Analytics | 9 | 410 | 5 | 0 |
| 2026-10-02 | /guide-a | Attribution | 18 | 560 | 11 | 2 |
From this structure, analysts can calculate citation trends, cited-page breadth, topic distribution, sessions associated with cited pages, and observed conversion rates. If source tables have different grains, aggregate them deliberately before joining. See data grain and dashboard double-counting for why mismatched grains can inflate measures.
Illustrative SQL: monthly page-level measurement
WITH monthly AS (
    SELECT
        DATE_TRUNC('month', date) AS month,
        page,
        topic,
        SUM(citations) AS citations,
        SUM(search_impressions) AS search_impressions,
        SUM(ai_referral_sessions) AS ai_referral_sessions,
        SUM(conversions) AS conversions
    FROM ai_search_page_daily
    GROUP BY 1, 2, 3
)

SELECT
    month,
    page,
    topic,
    citations,
    search_impressions,
    ai_referral_sessions,
    conversions,
    CASE
        WHEN ai_referral_sessions > 0
        THEN conversions * 1.0 / ai_referral_sessions
        ELSE NULL
    END AS observed_conversion_rate
FROM monthly
ORDER BY month DESC, citations DESC;
The query creates a descriptive reporting layer. It does not estimate causal impact. The observed conversion rate describes conversions among recorded AI referral sessions; it is not the percentage of citations that caused conversions.
What Should Leadership Actually See?
Executives usually do not need dozens of AI-search charts. A useful leadership view can answer five questions:
- Are we technically discoverable?
- Which topics and pages are being surfaced or cited?
- Is that visibility producing identifiable website activity?
- Are those visits producing valuable actions?
- Which conclusions are observational, and which have causal evidence?
That keeps reporting decision-oriented without pretending the measurement environment is more complete than it is.
The Core Principle
AI search does not eliminate the fundamentals of analytics; it makes them more important. Define the unit of measurement. Separate funnel stages. Keep page identities consistent. Distinguish visibility from traffic, traffic from conversion, and attribution from causality. Connect metrics to business decisions instead of optimizing whichever number happens to be newest.
The goal is not one perfect “AI visibility score.” It is a measurement system that shows where content is discovered, how it is referenced, what observable behavior follows, and what the evidence can legitimately support.
References / Further Reading
- Microsoft Bing Webmaster Blog — Introducing AI Performance in Bing Webmaster Tools Public Preview (February 10, 2026)
- Microsoft Bing — New AI Visibility Insights in Bing Webmaster Tools (June 16, 2026)
- Microsoft Bing Webmaster Blog — Keeping Content Discoverable with Sitemaps in AI Powered Search (July 31, 2025)
Build a Search Measurement System You Can Actually Use
UAD Consulting helps businesses connect SEO, digital analytics, measurement design, and decision-ready reporting so visibility metrics can be interpreted in the context of real business outcomes.
Explore ServicesGet in Touch