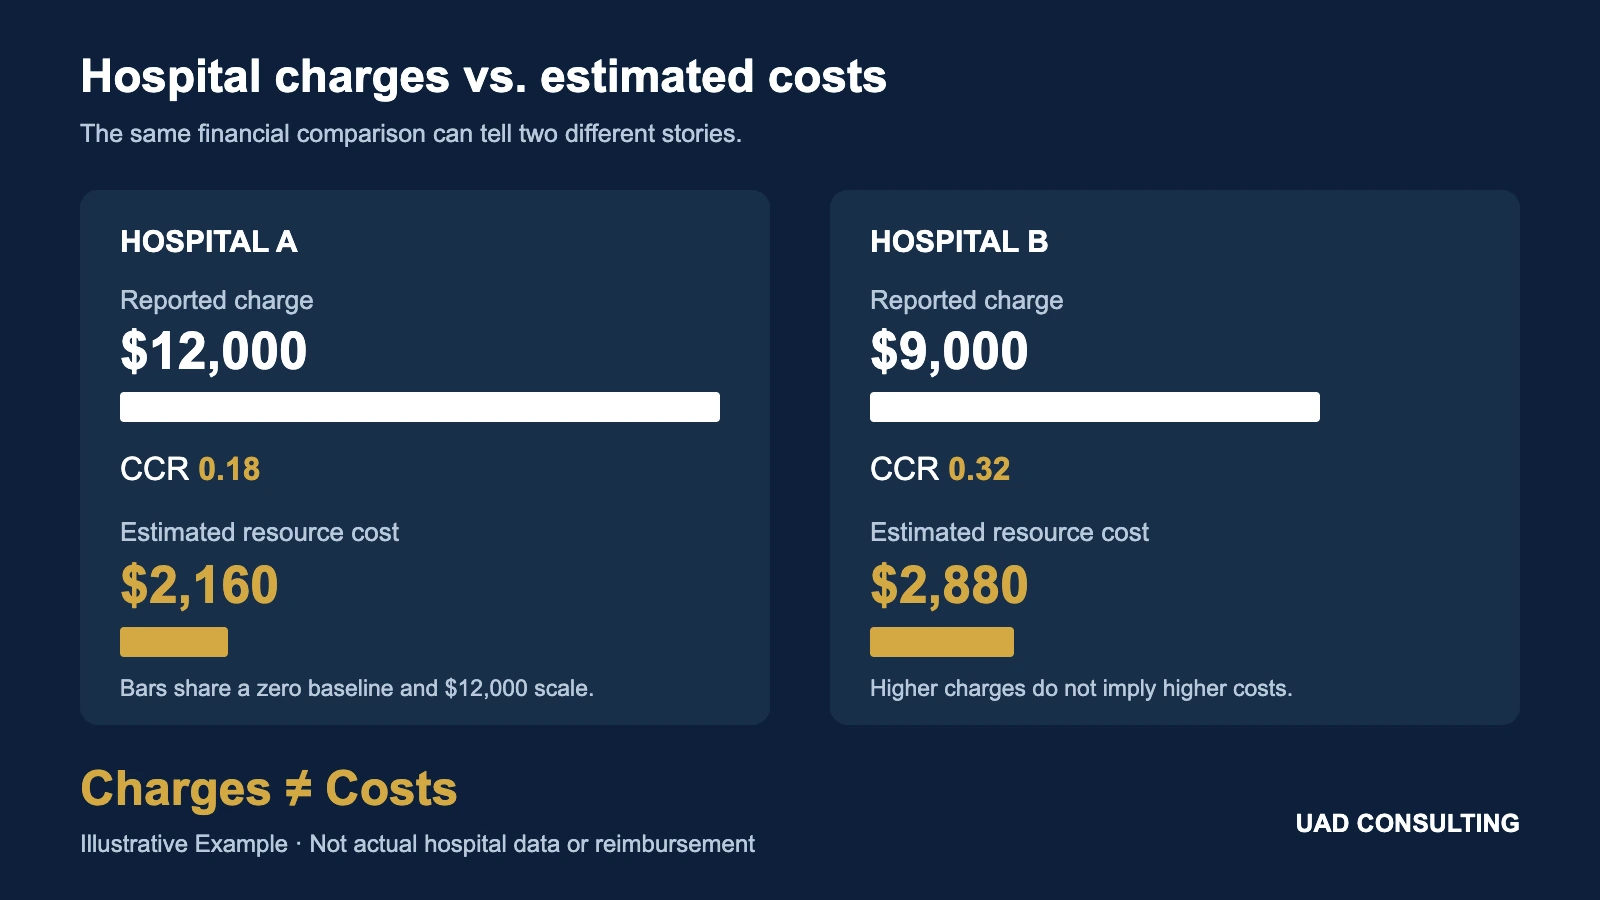
Imagine that two hospitals treat patients with similar emergency department needs.
Hospital A reports an average charge of $12,000 per visit.
Hospital B reports an average charge of $9,000.
At first glance, Hospital A appears substantially more expensive.
Its reported charges are approximately 33% higher.
A healthcare administrator comparing the two hospitals might conclude that Hospital B delivers care more efficiently.
A researcher estimating the economic burden of emergency department utilization might reach a similar conclusion.
But there is an important problem.
Hospital charges are not the same as hospital costs.
The amount a hospital bills for an encounter does not necessarily represent the resources consumed in delivering that care.
It also does not necessarily represent the amount an insurer pays, the amount a patient owes, or the amount a hospital ultimately receives.
This distinction can materially change healthcare economic analysis.
In fact, after applying appropriate cost-to-charge ratios, Hospital A could have a lower estimated resource cost than Hospital B.
Understanding why requires distinguishing several financial concepts that are frequently combined incorrectly.
The Short Answer: Charges, Costs, and Payments Measure Different Things
Hospital financial information can describe several different quantities.
Charges represent amounts billed by the hospital for services.
Resource costs represent expenses associated with producing those services, such as personnel, supplies, utilities, and allocated overhead.
Payments represent amounts actually received from payers and patients.
Patient out-of-pocket costs represent amounts borne by patients under applicable coverage and billing arrangements.
Avoidable costs concern resources that could actually be saved or redeployed if a service, encounter, or activity were prevented or changed.
These quantities are related, but they are not interchangeable.
A hospital can bill $12,000 for an encounter while its estimated resource cost is substantially lower.
The hospital may receive a payment that differs from both amounts.
And preventing the encounter may not eliminate every expense included in the estimated resource cost.
The appropriate measure depends on the decision being evaluated.
For example:
A researcher estimating hospital resource utilization may need estimated delivery costs.
An insurer evaluating expenditures may need actual payments.
A hospital evaluating financial performance may need revenue, reimbursement, and operating costs.
A health system considering a new intervention may need incremental costs across the relevant care pathway.
The first step in healthcare cost analysis is therefore not selecting a formula.
It is defining what the analysis is trying to measure.
What Is a Healthcare Cost-to-Charge Ratio?
A cost-to-charge ratio, commonly abbreviated CCR, is a method used to estimate hospital resource costs from reported charges.
The basic formula is:
Cost-to-Charge Ratio = Hospital Costs / Hospital Charges
When an appropriate ratio is available, estimated encounter cost can be calculated as:
Estimated Cost = Reported Charge × CCR
For example, suppose a hospital reports:
Total relevant charges: $10,000,000
Corresponding costs: $2,500,000
The ratio is:
CCR = $2,500,000 / $10,000,000
CCR = 0.25
Under this simplified example, the hospital's estimated cost is 25 cents for every dollar charged.
An encounter with a $10,000 charge would have an estimated cost of:
The result is an estimate derived from the relationship between costs and charges.
It is not a direct measurement of the exact resources consumed by that individual patient.
Two encounters with the same charges may have different underlying resource requirements.
A single hospital-level ratio cannot fully capture every difference in patient-level resource use.
Nevertheless, cost-to-charge ratios provide an established approach for estimating resource costs when more detailed cost-accounting information is unavailable.
The Healthcare Cost and Utilization Project, or HCUP, provides supplemental CCR files for several administrative healthcare databases.
These files support research into healthcare utilization, resource costs, and economic outcomes.
A Worked Example: The Hospital With Higher Charges but Lower Estimated Costs
Return to our two hypothetical hospitals.
Both hospitals treat comparable groups of emergency department patients.
For this simplified illustration, assume the same average clinical case mix and the same number of visits.
The hospitals report different average charges and have different cost-to-charge ratios.
| Measure | Hospital A | Hospital B |
|---|---|---|
| Average ED charge | $12,000 | $9,000 |
| Cost-to-charge ratio | 0.18 | 0.32 |
| Estimated cost per visit | $2,160 | $2,880 |
| Illustrative visit count | 500 | 500 |
The calculations are straightforward.
Hospital A
Average charge:
$12,000
CCR:
0.18
Estimated resource cost:
Hospital B
Average charge:
$9,000
CCR:
0.32
Estimated resource cost:
Now compare the results.
Hospital A has higher charges.
But Hospital B has higher estimated resource costs.
The difference in charges is:
($12,000 - $9,000) / $9,000
= 33.3%
Hospital A charges approximately 33.3% more than Hospital B.
However, the difference in estimated costs is:
($2,880 - $2,160) / $2,880
= 25%
Hospital A's estimated cost per visit is 25% lower than Hospital B's.
The ranking reverses.
Before applying CCRs:
Hospital A appears more expensive.
After applying CCRs:
Hospital B has the higher estimated resource cost.
This is not a statistical paradox.
The analysis is measuring different quantities.
The charge comparison describes billed amounts.
The CCR-adjusted comparison estimates hospital resource costs.
Neither calculation is inherently incorrect.
The problem arises when one quantity is presented as though it were another.
All figures in this example are hypothetical and do not represent actual hospitals or HCUP observations.
How Much Difference Does This Make Across Multiple Visits?
Suppose each hospital provides 500 visits with the same average charges and applicable CCRs.
Hospital A's total estimated resource cost would be:
500 × $2,160
= $1,080,000
Hospital B's total estimated resource cost would be:
500 × $2,880
= $1,440,000
The difference is:
$1,440,000 - $1,080,000
= $360,000
A comparison based on charges alone would suggest the opposite ranking.
Hospital A's total charges would be:
Hospital B's total charges would be:
Hospital A bills $1.5 million more.
Yet its estimated resource costs are $360,000 lower.
This illustrates why the choice of financial measure matters.
However, the example does not prove that Hospital A is more efficient.
Real hospitals may differ in patient severity, staffing models, service mix, geography, teaching status, accounting practices, and other factors.
A defensible efficiency comparison would need to consider those differences.
CCR adjustment changes the financial quantity being estimated.
It does not automatically make hospitals clinically or operationally comparable.
When Can the Ranking Reverse?
The two-hospital example also provides a useful analytical threshold.
Hospital A's estimated cost is:
Cost A = Charge A × CCR A
Hospital B's estimated cost is:
Cost B = Charge B × CCR B
Hospital A has a lower estimated cost when:
Charge A × CCR A < Charge B × CCR B
Using the hypothetical values:
$12,000 × 0.18 < $9,000 × CCR B
$2,160 < $9,000 × CCR B
Therefore:
CCR B > $2,160 / $9,000
CCR B > 0.24
This is the threshold.
If Hospital B's CCR exceeds 0.24, its estimated cost exceeds Hospital A's $2,160.
If Hospital B's CCR equals 0.24, the estimated costs are equal.
If Hospital B's CCR is below 0.24, Hospital B has the lower estimated cost.
Our example assumes Hospital B's CCR is 0.32.
That places it above the threshold.
This calculation is useful because it makes the comparison's sensitivity explicit.
Instead of simply reporting that one hospital is more expensive, the analyst can explain which assumptions determine the ranking.
A threshold analysis does not establish which CCR is correct.
It shows how the result depends on the ratio being applied.
Where Do Healthcare Cost-to-Charge Ratios Come From?
In the United States, HCUP develops CCR files using hospital financial information derived from Medicare cost reports.
These reports contain information about hospital costs and charges across relevant cost centers.
The Centers for Medicare & Medicaid Services maintains hospital cost report information through the Healthcare Provider Cost Reporting Information System, or HCRIS.
HCUP uses these data to construct ratios appropriate for specific databases and service categories.
The underlying methodology involves more than dividing one arbitrary number by another.
Hospital cost reports distinguish different service areas and include accounting allocations.
HCUP also applies data-quality checks and methodologies for handling unavailable or implausible values.
The resulting ratios are designed to support cost estimation within the applicable HCUP database.
This matters because a CCR should not be treated as a universal hospital conversion factor.
A ratio developed for inpatient services is not automatically appropriate for emergency department services.
A ratio from one year should not automatically be applied to another year.
And a ratio developed for one database should not be assumed compatible with an unrelated data source.
The correct ratio depends on the analytical context.
For methodology details, see the HCUP Cost-to-Charge Ratio Methodologies report published by the Agency for Healthcare Research and Quality.
Emergency Department Costs Require Special Attention
Emergency department data introduce additional complications.
HCUP provides specific cost-to-charge ratio files for emergency department analysis.
These files are available for the Nationwide Emergency Department Sample, or NEDS, and the State Emergency Department Databases, or SEDD.
The distinction between emergency department and inpatient CCRs is important.
Emergency department resource use can differ substantially from inpatient resource use.
A hospital-wide inpatient ratio may reflect a mixture of services that is not appropriate for estimating ED costs.
HCUP's emergency department CCR documentation explicitly cautions against substituting inpatient CCRs when estimating ED costs for admitted patients.
Using the wrong ratio can produce a mathematically valid calculation that answers the wrong economic question.
Treat-and-Release Visits
For NEDS records originating from the State Emergency Department Databases, identified by HCUPFILE = "SEDD", the variable TOTCHG_ED represents total hospital charges for services performed during the ED visit.
The corresponding CCR_NEDS value can be used to estimate ED resource costs.
The basic calculation is:
Estimated ED Cost = TOTCHG_ED × CCR_NEDS
The result estimates hospital resource costs for the ED encounter.
It does not include every possible component of the patient's economic burden.
For example, HCUP hospital charge measures generally exclude separately billed professional physician fees.
Emergency Department Visits Resulting in Admission
NEDS also includes ED visits that result in admission to the same hospital.
These records originate from the State Inpatient Databases and are identified by HCUPFILE = "SID".
For these encounters, TOTCHG_ED represents the portion of total inpatient charges attributed to the hospital's ED unit.
However, other services performed while the patient was in the ED may not be identifiable as ED services within the inpatient record.
Examples can include imaging and laboratory services.
As a result, the reported ED charge component may not capture every service delivered during the ED phase of care.
The estimated ED cost can therefore be understated.
The January 2026 HCUP ED CCR user guide explicitly discusses this limitation.
It also notes that ED charge information is unavailable for a substantial number of admitted ED records.
Researchers should report missingness and interpret these estimates cautiously.
This is an important example of why applying a correct formula does not guarantee a complete cost estimate.
The underlying measurement must also be appropriate.
Which Variables Matter in HCUP NEDS?
For researchers working with the Nationwide Emergency Department Sample, several variables are especially relevant.
| Variable | Analytical Role |
|---|---|
| TOTCHG_ED | Reported ED hospital charges |
| CCR_NEDS | ED cost-to-charge ratio |
| HOSP_ED | NEDS hospital identifier for appropriate linkage |
| HCUPFILE | Distinguishes relevant source record types |
| DISCWT | Visit-level weight used for national estimates |
| NEDS_STRATUM | Sampling stratum used in survey analysis |
The appropriate NEDS CCR file should be matched to the corresponding data year.
Researchers should use the documented linkage identifiers.
The NEDS-specific CCR variable is CCR_NEDS.
The HCUP ED CCR user guide explains that this value uses a hospital-specific ED ratio when available and a group-average ratio otherwise.
The NEDS ratios are also subject to confidentiality-related adjustments.
This means that a provided CCR is not always a direct, unmodified hospital-specific accounting ratio.
That distinction matters when interpreting hospital-level differences.
For a multi-year study, analysts should use the correct year-specific files and should not assume hospital identifiers provide longitudinal linkage across years.
Do Not Confuse SEDD and NEDS Variables
The appropriate charge and CCR variables depend on the database.
For NEDS, the relevant ED charge variable is TOTCHG_ED and the corresponding CCR variable is CCR_NEDS.
For SEDD, the relevant total charge variable is TOTCHG, and the supplemental ED CCR files provide variables such as APECC and GAPECC.
The ED CCR guide specifies HOSPID for SEDD linkage and HOSP_ED for NEDS linkage.
The correct linkage procedures and available identifiers must be checked against the documentation for the specific database and year.
The two workflows should not be treated as interchangeable.
Reproduce the Two-Hospital Comparison in SQL
The hypothetical example can be reproduced using GoogleSQL.
The query below uses synthetic values defined directly in the query.
It does not access actual HCUP records.
WITH hypothetical_hospitals AS (

  SELECT
    'Hospital A' AS hospital,
    12000.0 AS average_ed_charge,
    0.18 AS ed_ccr,
    500 AS visit_count

  UNION ALL

  SELECT
    'Hospital B' AS hospital,
    9000.0 AS average_ed_charge,
    0.32 AS ed_ccr,
    500 AS visit_count

)

SELECT

  hospital,

  average_ed_charge,

  ed_ccr,

  visit_count,

  ROUND(
    average_ed_charge * ed_ccr,
    2
  ) AS estimated_cost_per_visit,

  ROUND(
    average_ed_charge * visit_count,
    2
  ) AS total_reported_charges,

  ROUND(
    average_ed_charge * ed_ccr * visit_count,
    2
  ) AS total_estimated_resource_cost

FROM hypothetical_hospitals

ORDER BY hospital;
Expected output:
| Hospital | Cost per Visit | Total Charges | Total Estimated Costs |
|---|---|---|---|
| Hospital A | $2,160 | $6,000,000 | $1,080,000 |
| Hospital B | $2,880 | $4,500,000 | $1,440,000 |
The query demonstrates the arithmetic.
It is not a complete production workflow for HCUP data.
A real analysis requires additional checks for valid charges, missing CCR values, correct linkage, patient eligibility, survey design, and the intended population.
It also requires careful interpretation of which services the charge variable represents.
What Should a Production HCUP Cost Pipeline Validate?
A defensible cost-estimation workflow should include several checks before producing final results.
First, verify the source database and data year.
Second, identify the charge variable appropriate to the encounter type.
Third, join the matching supplemental CCR file using the documented identifiers.
Fourth, verify that the join does not create duplicate encounter records.
Fifth, examine missing, invalid, or implausible charge and CCR values.
Sixth, calculate estimated costs only for records meeting the defined analytical rules.
Seventh, retain indicators describing missingness and estimation limitations.
Eighth, apply survey weights and appropriate variance-estimation methods when producing population-level estimates.
Finally, compare results across relevant subgroups and sensitivity assumptions.
For example, missing ED charges may be concentrated among admitted encounters rather than distributed uniformly.
If those encounters differ systematically from treat-and-release visits, complete-case analysis may produce misleading cost summaries.
The analyst should not silently replace missing charges or CCRs with arbitrary values.
Any imputation or exclusion strategy should be documented and justified.
The purpose of these checks is not simply to prevent software errors.
It is to ensure that the resulting estimate corresponds to the intended economic quantity.
Why Survey Weights Matter for National Healthcare Cost Estimates
NEDS is a sample of emergency department visits.
Its unweighted records do not directly represent the complete national population of ED encounters.
To estimate national visit-level totals, analysts generally need to apply the appropriate discharge weights.
The NEDS variable DISCWT provides visit-level weights for national estimation.
For a simple conceptual total:
Weighted Estimated Cost =
Sum of (Estimated Encounter Cost × DISCWT)
A weighted mean would divide the weighted sum of costs by the corresponding sum of weights among eligible observations.
However, calculating national estimates involves more than multiplying by weights.
NEDS has a stratified sampling design.
Appropriate standard errors and confidence intervals require survey-design-aware methods.
Analysts should use the relevant HCUP documentation, including design variables and year-specific guidance.
A simple SQL weighted sum may provide a descriptive point estimate under appropriate assumptions.
It does not automatically provide a valid design-based confidence interval.
Also, missing costs can affect weighted estimates.
If observations with missing charges or CCRs are excluded, the remaining weighted sample may not adequately represent the intended population.
That limitation should be assessed rather than ignored.
Why Estimated Hospital Costs Are Not Automatically Avoidable Savings
Suppose a healthcare intervention could prevent 100 emergency department visits.
The estimated resource cost per visit is $2,160.
A straightforward calculation gives:
100 × $2,160
= $216,000
Can the organization claim that preventing those visits would save $216,000?
Not necessarily.
The $216,000 represents the estimated allocated resource cost associated with those visits under the model's assumptions.
It is not automatically the amount of cash expenditure that would disappear.
Some hospital costs vary directly with patient volume.
Others are fixed over the relevant decision horizon.
For example, preventing a visit may reduce the use of certain supplies or medications.
But the hospital may still pay for its building, equipment, staffing commitments, and other overhead.
The financial consequences also depend on whether capacity is reduced, redeployed, or used to treat other patients.
A hospital may experience changes in revenue as well as changes in cost.
From a broader health-system perspective, preventing an ED visit could also change spending on outpatient care, follow-up treatment, transportation, or other services.
Therefore, the economic impact of avoiding an encounter depends on the perspective and the counterfactual care pathway.
This is a critical distinction.
Estimated resource cost is not synonymous with marginal cost.
And marginal cost is not necessarily the same as realized budget savings.
A More Defensible Economic Evaluation
Before reporting avoidable expenditure, define:
The intervention being evaluated.
The patient population affected.
The comparison or usual-care pathway.
The expected number of encounters prevented.
The relevant time horizon.
The cost perspective.
Which resource costs would actually change.
Whether downstream services would increase or decrease.
Whether fixed costs remain.
And the uncertainty around these assumptions.
A CCR-adjusted encounter cost may provide an input to this evaluation.
It does not replace the evaluation itself.
For readers exploring how costs and outcomes are combined in formal economic models, see UAD Consulting's article on decision trees and Markov models in healthcare cost-effectiveness analysis.
Charges, Costs, Reimbursement, and Savings: A Practical Comparison
| Measure | What It Represents | Common Analytical Use |
|---|---|---|
| Hospital charges | Amount billed for services | Billing and charge-based reporting |
| Estimated resource costs | Estimated expenses of producing services | Utilization and economic analysis |
| Payments or reimbursement | Amounts received from payers and patients | Payer expenditure and hospital revenue analysis |
| Patient out-of-pocket costs | Amounts borne by patients | Patient financial burden |
| Marginal costs | Additional or avoidable costs associated with a change in activity | Operational and economic decisions |
| Net budget impact | Change in spending under a defined implementation scenario | Financial planning |
These quantities can differ substantially.
No single measure is universally best.
The appropriate choice depends on the perspective and decision.
For example, a payer deciding whether to reimburse a new treatment may prioritize payments and covered expenditures.
A hospital evaluating operational efficiency may need detailed cost-accounting information.
A societal economic evaluation may require costs outside the hospital.
A national utilization study may rely on CCR-adjusted administrative data because detailed patient-level cost accounting is unavailable.
The key is to define the quantity before selecting the data.
Does a Lower CCR Mean a Hospital Is More Efficient?
Not necessarily.
A lower cost-to-charge ratio means that estimated costs are lower relative to reported charges.
That relationship can change because of costs, charges, or both.
A hospital could have a low CCR because its charges are relatively high.
Another could have a higher CCR because its charges are relatively low.
The ratios alone do not establish differences in clinical quality, productivity, patient outcomes, or operational efficiency.
Hospital comparisons also require attention to patient case mix, service intensity, geography, wage levels, and accounting practices.
An apparent association between CCR-adjusted costs and hospital characteristics should not automatically be interpreted causally.
For example, finding that hospitals with a particular organizational structure have lower estimated costs does not establish that the organizational structure caused those differences.
Other factors may explain the association.
A causal claim would require an appropriate research design and defensible assumptions.
When Should Analysts Use Sensitivity Analysis?
CCR-adjusted cost estimates depend on assumptions and measurement limitations.
Sensitivity analysis can help determine whether those uncertainties materially affect a decision.
In the two-hospital example, the ranking changed when Hospital B's CCR crossed 0.24.
That threshold is analytically useful.
A real evaluation might examine:
Alternative plausible CCR values.
Different handling of missing charges.
Different patient populations.
Alternative encounter definitions.
Changes in service utilization.
Different assumptions about avoidable resource costs.
Alternative economic perspectives.
The objective is not to generate the largest possible collection of scenarios.
It is to identify which uncertainties could change the decision.
For example, if every plausible CCR assumption produces the same hospital cost ranking, the ranking may be relatively robust to CCR uncertainty.
If a small change in the ratio reverses the ranking, the conclusion requires greater caution.
A sensitivity analysis should not present hypothetical scenarios as though they were empirically observed outcomes.
The analyst should distinguish the available evidence from the assumptions used to interpret it.
A Practical Framework for Healthcare Cost Analysis
Before presenting hospital cost estimates to decision-makers, answer six questions.
1. What Is the Economic Perspective?
Are we analyzing hospital resource costs, payer expenditures, patient financial burden, or societal costs?
The perspective determines which costs belong in the analysis.
2. What Does the Charge Variable Represent?
Does it cover the full encounter, only the emergency department component, or a specific service category?
Are professional fees excluded?
3. Is the CCR Appropriate?
Does the ratio match the database, year, hospital, and service type?
Was a hospital-specific or group-average ratio used?
4. How Complete Are the Data?
How many encounters lack valid charges or CCR information?
Does missingness differ across encounter types or hospitals?
5. What Population Does the Estimate Describe?
Is the result an unweighted sample statistic, a hospital-level estimate, or a national estimate?
Have appropriate survey weights and variance methods been used?
6. What Decision Will the Estimate Support?
Is the organization comparing utilization?
Evaluating an intervention?
Estimating economic burden?
Forecasting expenditure?
Or estimating avoidable costs?
The analysis should be designed around that decision.
A technically correct calculation is useful only when its interpretation matches the question being asked.
Frequently Asked Questions
Are hospital charges the same as actual costs?
No.
Hospital charges represent billed amounts.
Resource costs represent expenses associated with delivering services.
The two can differ substantially.
What does a CCR of 0.25 mean?
Under the applicable accounting and service definitions, estimated resource costs are approximately 25% of charges.
A $10,000 charge would correspond to an estimated cost of $2,500.
Can I use an inpatient CCR for emergency department costs?
Not automatically.
HCUP provides separate ED CCR files.
Its ED documentation specifically cautions against using inpatient CCRs to estimate ED costs for admitted patients.
Are HCUP cost estimates actual hospital payments?
No.
CCR-adjusted costs estimate resource costs.
They do not represent the specific payments received by hospitals.
Does a lower CCR mean better hospital efficiency?
No.
A lower CCR may reflect differences in charge structures as well as costs.
Efficiency comparisons require additional clinical, operational, and financial information.
Can CCR-adjusted costs be used in cost-effectiveness analysis?
Yes, when appropriate to the economic perspective and study design.
However, the analyst must consider cost coverage, uncertainty, the time horizon, and whether the estimates represent the relevant resources.
Can estimated ED costs be used to calculate avoidable savings?
They may serve as inputs.
But estimated resource costs are not automatically equivalent to marginal savings or realized budget reductions.
The economic consequences of preventing an encounter require additional assumptions.
The Most Important Step Is Defining What Cost Means
Return to the two hospitals.
Hospital A billed $12,000 per visit.
Hospital B billed $9,000.
Looking only at charges, Hospital A appeared more expensive.
After applying the hypothetical CCRs, Hospital A's estimated resource cost was $2,160.
Hospital B's was $2,880.
The apparent ranking reversed.
Nothing about the underlying patient care changed.
The difference came from measuring a different financial quantity.
This is why healthcare economic analysis should not begin and end with a billing variable.
Charges, costs, reimbursement, and avoidable expenditure answer different questions.
Cost-to-charge ratios provide a useful method for estimating resource costs from administrative data.
But they do not eliminate limitations involving accounting assumptions, missing information, service coverage, patient differences, or economic perspective.
A defensible analysis makes those limitations explicit.
The goal is not simply to convert charges into another number.
It is to produce an estimate that can support the decision being made.
References and Further Reading
- Agency for Healthcare Research and Quality. Healthcare Cost and Utilization Project. Cost-to-Charge Ratio for Emergency Department Files. Updated May 2026.
- Agency for Healthcare Research and Quality. User Guide: Cost-to-Charge Ratio for Emergency Department Files, 2012–2023. Updated January 14, 2026.
- Pickens GT, Liang L, Roemer M. HCUP Cost-to-Charge Ratio Methodologies. HCUP Methods Series Report 2021-05. Agency for Healthcare Research and Quality. December 17, 2021.
- Centers for Medicare & Medicaid Services. Cost Reports.
- Agency for Healthcare Research and Quality. HCUP National Estimates Tutorial. Nationwide Emergency Department Sample: Weighting and Estimation.
All numerical examples in this article are hypothetical.
They are provided for educational purposes and do not represent actual hospital observations, client findings, or unpublished healthcare research.
Make Healthcare Cost Analysis More Decision-Ready
Healthcare economic decisions require more than accurate calculations.
They require clear definitions, appropriate data, transparent assumptions, and an understanding of what the results can support.
UAD Consulting helps organizations analyze healthcare utilization, administrative data, costs, and outcomes through practical analytical frameworks.
Whether the challenge involves HCUP data, cost-to-charge ratios, economic evaluation, or uncertainty in healthcare cost estimates, the objective is to connect available evidence with defensible decisions.
Explore our Health Economics & Outcomes Research services to discuss your healthcare analytics or economic evaluation needs.
Explore ServicesGet in Touch