Customer acquisition cost is one of the most familiar metrics in growth and marketing analytics.
If a company spends $100,000 on acquisition and gains 2,000 new customers, the arithmetic appears simple:
CAC = $100,000 / 2,000 = $50 per customer
But that number does not answer the question a business usually cares about:
Were those customers worth acquiring?
A $50 CAC can be excellent for one customer cohort and uneconomic for another. Two campaigns can produce exactly the same acquisition cost while generating very different repeat purchases, gross margins, refunds, retention patterns, and cash-flow profiles.
That is why acquisition analysis should not stop at CAC.
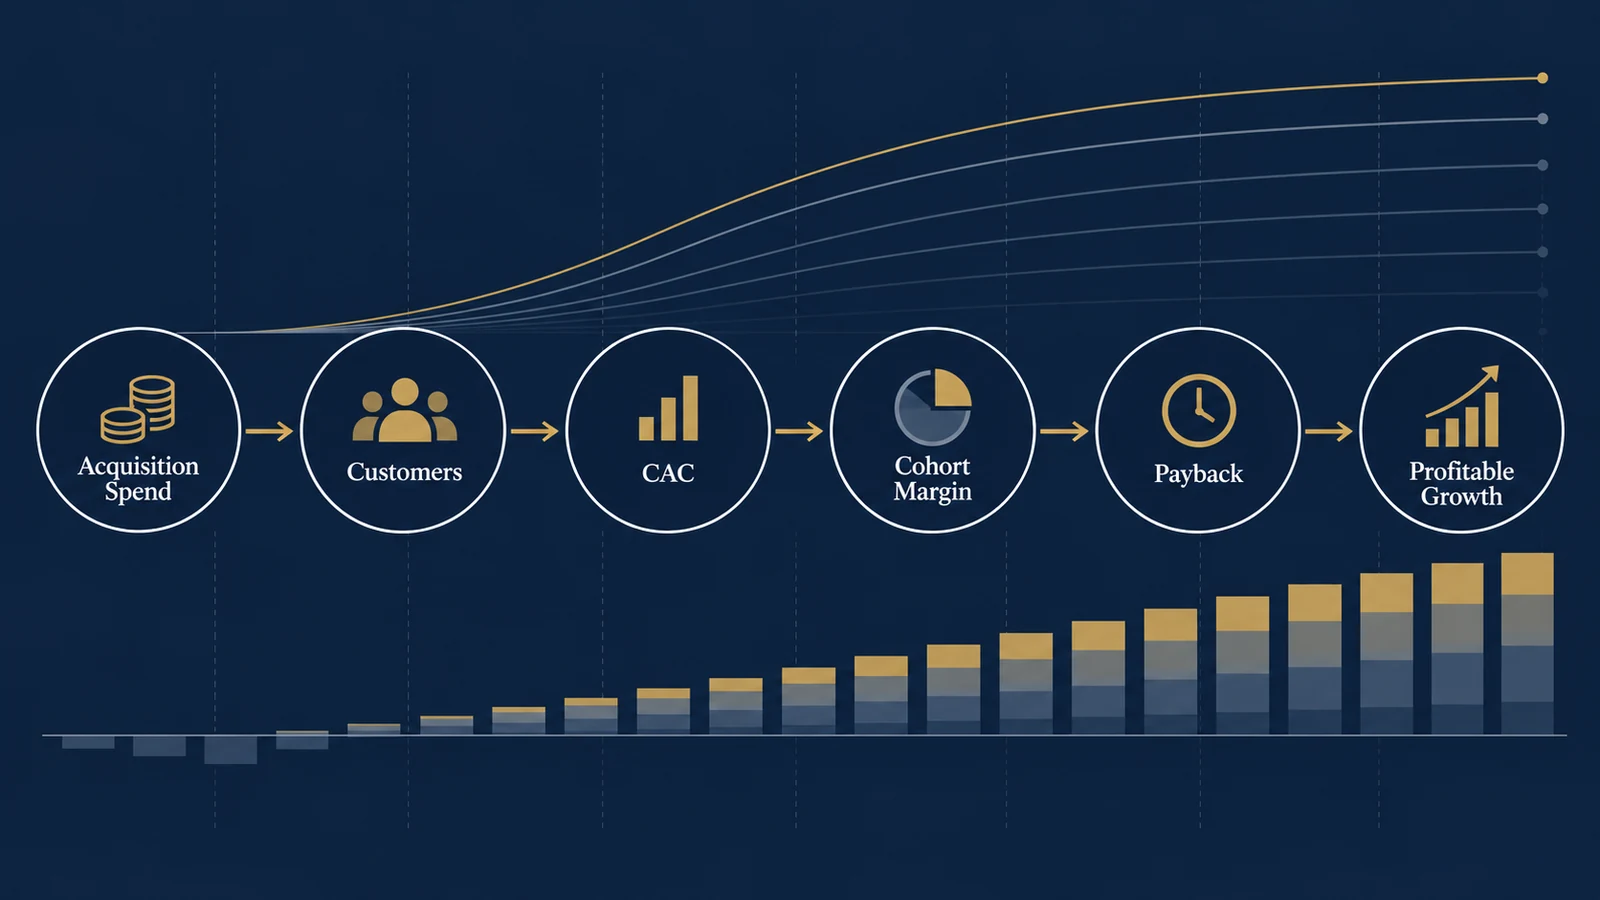
A more useful framework connects acquisition cost to the economics of the customers acquired:
- Acquisition Spend
- Customers
- CAC
- Cohort Margin
- Payback
- Profitable Growth
This changes the question from “How cheaply did we acquire customers?” to:
“How much economic value did each acquisition cohort create, and how long did it take to recover the cost of acquiring it?”
CAC Is a Cost Metric, Not a Profitability Metric
The basic CAC formula is:
CAC = Acquisition Spend / New Customers Acquired
Suppose two campaigns each spend $60,000. Campaign A acquires 1,000 customers. Campaign B also acquires 1,000 customers. Both therefore report CAC = $60.
If CAC is the primary KPI, the campaigns appear equally effective. Now consider what happens after acquisition.
| Metric | Campaign A | Campaign B |
|---|---|---|
| Acquisition spend | $60,000 | $60,000 |
| New customers | 1,000 | 1,000 |
| CAC | $60 | $60 |
| First-order revenue/customer | $90 | $90 |
| First-order gross margin | 50% | 50% |
| 6-month repeat revenue/customer | $120 | $45 |
| Repeat revenue gross margin | 55% | 55% |
Both campaigns acquired customers at the same cost, but they did not acquire customers with the same economics.
For Campaign A, first-order contribution is $90 × 50% = $45. Six-month repeat contribution is $120 × 55% = $66. Total six-month contribution is $111 per customer, or $51 after subtracting the $60 CAC.
For Campaign B, first-order contribution is $45 and six-month repeat contribution is $45 × 55% = $24.75. Total six-month contribution is $69.75, or $9.75 after CAC.
The acquisition dashboards would report the same CAC. The business outcomes are very different. Campaign A generates more than five times the six-month post-acquisition contribution per customer in this simplified example.
Revenue-Based LTV Can Still Mislead
A common response is to compare CAC with customer lifetime value. That is directionally useful, but the definition of LTV matters.
A revenue-based LTV estimate might look like:
LTV = Average Order Value × Purchase Frequency × Customer Lifespan
For example, with an $80 average order value, 3 purchases per year, and a 2-year lifespan, revenue LTV is $80 × 3 × 2 = $480. If CAC is $100, an analyst might report an LTV:CAC ratio of 4.8×.
That appears attractive. But revenue is not contribution.
Suppose the business has a 40% contribution margin after product costs, payment costs, fulfillment, discounts, and other variable costs included in its chosen contribution definition. Contribution-based customer value becomes $480 × 40% = $192. The comparable relationship is $192 / $100 = 1.92×.
The underlying customer did not change. The analytical definition did.
This is why a business should document exactly what its “LTV” metric contains before using an LTV:CAC ratio for acquisition decisions. Depending on the decision, contribution margin may provide a more useful economic basis than revenue alone.
Cohorts Solve a Timing Problem That Averages Hide
Customer value is realized over time. CAC is usually incurred near the beginning of the customer relationship, while repeat purchases and margin may arrive months or years later. Blended averages can hide that timing.
A cohort approach groups customers using a meaningful acquisition definition—often acquisition month—and follows the same group through subsequent periods.
| Acquisition Cohort | Month 0 | Month 1 | Month 2 | Month 3 | Month 6 |
|---|---|---|---|---|---|
| January | $38 | $52 | $65 | $76 | $105 |
| February | $37 | $49 | $60 | $69 | $91 |
| March | $39 | $46 | $54 | $60 | $74 |
Assume these values represent cumulative contribution margin per acquired customer before subtracting CAC. A blended company average might still look stable, but the cohort table reveals that newer customers are accumulating contribution more slowly.
That could reflect a change in acquisition channel mix, a promotion that attracted lower-retention customers, a pricing change, a product or onboarding problem, seasonality, a measurement change, or ordinary sampling variation.
The cohort pattern identifies a question. It does not, by itself, identify the cause.
Payback Period Connects Customer Economics to Cash Flow
Lifetime value can be large while the business still faces an acquisition problem.
Consider a customer with CAC = $120 and expected contribution over 24 months = $300. On a lifetime basis, the acquisition may look attractive. But suppose cumulative contribution develops like this:
| Month | Cumulative Contribution |
|---|---|
| 0 | $35 |
| 1 | $52 |
| 2 | $69 |
| 3 | $84 |
| 4 | $98 |
| 5 | $111 |
| 6 | $123 |
The company does not recover the $120 acquisition cost until approximately Month 6. That is the CAC payback period.
For a cash-constrained company, the difference between a two-month and a twelve-month payback period can materially affect how quickly acquisition can scale—even if both cohorts eventually become profitable.
A useful acquisition dashboard therefore separates at least three questions:
- Efficiency: What did it cost to acquire a customer?
- Economics: How much contribution did that customer generate?
- Timing: How long did it take to recover acquisition cost?
CAC answers only the first.
A Practical Cohort Profitability Framework
A useful analytical structure can be built in five layers.
1. Define the Acquisition Cohort
Choose a stable cohort definition. Common examples include first purchase month, first paid subscription month, first qualified contract date, or another clearly defined acquisition event.
Avoid changing cohort definitions between reports. If January means “first order” in one dashboard and “first website visit” in another, comparisons become unreliable.
2. Assign Acquisition Cost Consistently
Define which costs are included. Possible definitions range from paid-media spend only to a broader fully loaded acquisition cost including agency fees, creative production, sales commissions, or acquisition technology.
Neither definition is universally correct. The important requirement is consistency and decision relevance. A marketing optimization question may reasonably use media CAC; a company-level unit economics question may require a broader acquisition-cost definition.
3. Measure Customer Contribution Over Time
For each cohort and period, calculate the economic value generated by the acquired customers.
Contribution = Revenue − Variable Costs
The exact variable-cost definition depends on the business. It may include cost of goods sold, payment processing, fulfillment, shipping subsidies, usage-dependent infrastructure, returns, discounts, or variable service delivery costs.
The purpose is not to force every business into one accounting definition. The purpose is to make the economic definition explicit.
4. Calculate Cumulative Contribution
For customer i through month t:
Cumulative Contributioni,t = Σ Contributioni,m
Then calculate cohort-level cumulative contribution per acquired customer:
Cohort Contribution per Customer = Total Cumulative Cohort Contribution / Customers Acquired
This produces a curve that can be compared directly with CAC.
5. Identify Payback
Payback occurs when:
Cumulative Contribution per Customer ≥ CAC
If CAC is $80 and cumulative contribution reaches Month 0: $32, Month 1: $49, Month 2: $63, Month 3: $74, and Month 4: $84, the cohort reaches payback during Month 4.
For more precision, the analysis can interpolate within the period, but monthly granularity is often sufficient for managerial decisions.
A Simple SQL Pattern for Cohort Analysis
The implementation depends on the data model, but a warehouse analysis might begin with customer acquisition dates and order-level contribution.
WITH first_purchase AS (
    SELECT
        customer_id,
        MIN(order_date) AS first_order_date
    FROM orders
    GROUP BY customer_id
),

customer_orders AS (
    SELECT
        o.customer_id,
        DATE_TRUNC('month', f.first_order_date) AS cohort_month,
        DATE_TRUNC('month', o.order_date) AS order_month,
        o.revenue - o.variable_cost AS contribution
    FROM orders o
    JOIN first_purchase f
      ON o.customer_id = f.customer_id
),

cohort_value AS (
    SELECT
        cohort_month,
        order_month,
        COUNT(DISTINCT customer_id) AS active_customers,
        SUM(contribution) AS contribution
    FROM customer_orders
    GROUP BY 1, 2
)

SELECT *
FROM cohort_value
ORDER BY cohort_month, order_month;
In a production model, the analyst would also need to address refunds, canceled orders, attribution windows, customer identity resolution, acquisition-cost allocation, currency, taxes, partial periods, and cohort maturity.
A cohort that is only two months old should not be compared naively with a cohort that has twelve months of observed history.
Why Channel-Level LTV Can Be Especially Useful
Suppose paid search and paid social both report a CAC of $70. The acquisition dashboard might treat them as equivalent. But after six months:
| Metric | Paid Search | Paid Social |
|---|---|---|
| CAC | $70 | $70 |
| 6-month revenue/customer | $210 | $165 |
| Contribution margin | 45% | 42% |
| 6-month contribution | $94.50 | $69.30 |
| Contribution after CAC | $24.50 | −$0.70 |
Now the channel decision looks different. But observed channel cohorts are not necessarily causal estimates of channel quality.
Customers arriving through paid search may have different intent, demographics, product preferences, prior brand exposure, geography, or purchase readiness than customers arriving through paid social.
The cohort analysis describes what happened to customers associated with each channel. It does not prove that changing the channel caused the difference in customer value.
That is the same reason attribution and incrementality should not be treated as interchangeable concepts.
For questions about causal acquisition impact, businesses may need experiments, geo tests, holdouts, or other incrementality methods in addition to observational cohort reporting.
CAC Payback and Marginal ROAS Answer Different Questions
Another common mistake is to collapse acquisition economics into a single metric.
Marginal ROAS asks what additional return is generated by the next increment of marketing spend. CAC payback asks how long the contribution generated by acquired customers takes to recover acquisition cost.
Both can matter. A channel may have acceptable current CAC and strong historical LTV, but deteriorating marginal returns as spend increases. Historical customer economics can be attractive while the next dollar of acquisition spend is less attractive.
This is why acquisition planning should connect customer economics with marginal ROAS and diminishing returns rather than using either metric in isolation.
What Should an Acquisition Economics Dashboard Show?
A useful dashboard does not need dozens of metrics. Start with the decision.
For acquisition profitability, a practical view might include:
- Acquisition: spend, new customers, and CAC.
- Customer quality: repeat purchase rate, revenue per acquired customer, and contribution per acquired customer.
- Timing: cumulative contribution curve and CAC payback month.
- Segmentation: acquisition cohort, channel, campaign, and product or offer where appropriate.
- Business outcome: contribution after acquisition cost and the percentage of cohorts reaching target payback.
The dashboard should make it possible to move from “CAC increased” to “CAC increased, but the newer cohort also generates more contribution and still reaches payback within our target window.” Those are very different management conclusions.
This is closely related to which KPIs belong on a dashboard: the useful dashboard starts with the decision and then selects the measures needed to support it.
Common Analytical Mistakes
Comparing Immature and Mature Cohorts
A three-month-old cohort has had less opportunity to generate repeat purchases than a twelve-month-old cohort. Compare cohorts at equal maturity whenever possible.
Using Revenue Instead of Economic Contribution
Revenue can overstate customer value when variable costs differ materially across products, channels, or customer groups.
Ignoring Refunds and Returns
A channel that generates high initial revenue but unusually high returns may look better than it actually is.
Treating Predicted LTV as Observed Fact
Predicted LTV depends on assumptions about future retention, purchasing behavior, margins, and sometimes model structure. Forecasts should be labeled as forecasts.
Treating Cohort Differences as Causal Effects
A high-value cohort associated with a channel does not prove that the channel created the higher value. Selection effects and other confounding factors may explain part of the difference.
Optimizing CAC Without Considering Scale
A channel can produce a very low CAC at small spend and become progressively less efficient as investment increases. This is why customer economics and marginal budget analysis should be connected.
From Acquisition Reporting to Acquisition Decisions
The purpose of acquisition analytics is not to produce the lowest possible CAC. It is to help a business allocate capital toward customers whose expected economics justify the cost of acquiring them.
- Acquisition Cost
- Customer Cohort
- Contribution
- Payback
- Marginal Scale Decision
A company can then ask better questions:
- Which acquisition cohorts recover their cost fastest?
- Which channels generate customers with stronger contribution economics?
- Is higher CAC acceptable when customer quality also improves?
- Are newer cohorts becoming less valuable?
- How much acquisition spend can the business support before marginal returns deteriorate?
- Which apparent channel differences require causal testing before budget is reallocated?
CAC remains useful. It simply should not be the end of the analysis.
What did the business receive in return for the cost of acquiring the customer—and how long did it take to receive it?
References / Further Reading
Turn Acquisition Metrics Into Better Growth Decisions
UAD Consulting helps businesses connect marketing performance, customer behavior, and financial outcomes to build clearer acquisition and growth analytics.
Explore ServicesGet in Touch