A marketing manager opens the monthly advertising dashboard.
The results look encouraging.
Cost per lead has declined by 30%.
Lead volume has increased.
The advertising platform reports more conversions than the previous month.
Yet the sales team has a different perspective.
Fewer leads are becoming customers.
The sales pipeline is filling with prospects who do not meet the company's requirements.
And customer acquisition cost is increasing.
How can marketing performance improve while customer acquisition becomes more expensive?
The answer is that generating a lead and acquiring a customer are different economic outcomes.
A campaign can become more efficient at generating form submissions while becoming less efficient at producing paying customers.
This distinction matters for business-to-business marketing, professional services, healthcare services, education, insurance, real estate, and other industries where the customer journey extends beyond an initial website interaction.
The solution is not necessarily to stop measuring cost per lead.
It is to connect lead generation to qualification, sales outcomes, and customer economics.
What Is the Difference Between Cost per Lead and Customer Acquisition Cost?
Cost per lead, or CPL, measures the average acquisition spending associated with generating a lead.
A common formula is:
Suppose a campaign spends $10,000 and generates 500 leads.
CPL = $10,000 / 500
CPL = $20
This tells us how much advertising spending was associated with each recorded lead. It does not tell us whether those leads are qualified or whether they eventually become customers.
Customer acquisition cost, or CAC, evaluates spending relative to acquired customers.
For a simplified media-only calculation:
Suppose the same campaign generates 10 new customers.
Media-Only CAC = $10,000 / 10
Media-Only CAC = $1,000
The distinction is important. CPL describes the cost of generating an intermediate funnel outcome. CAC describes the cost associated with reaching a later business outcome.
Neither metric alone establishes how many customers were caused by advertising.
Also, media-only CAC is not necessarily the same as fully loaded CAC. A fully loaded acquisition cost may include relevant sales compensation, marketing personnel, software, agency fees, creative production, and other acquisition-related expenses. The cost definition must be consistent across comparisons.
A Worked Example: Two Campaigns With Opposite Performance Rankings
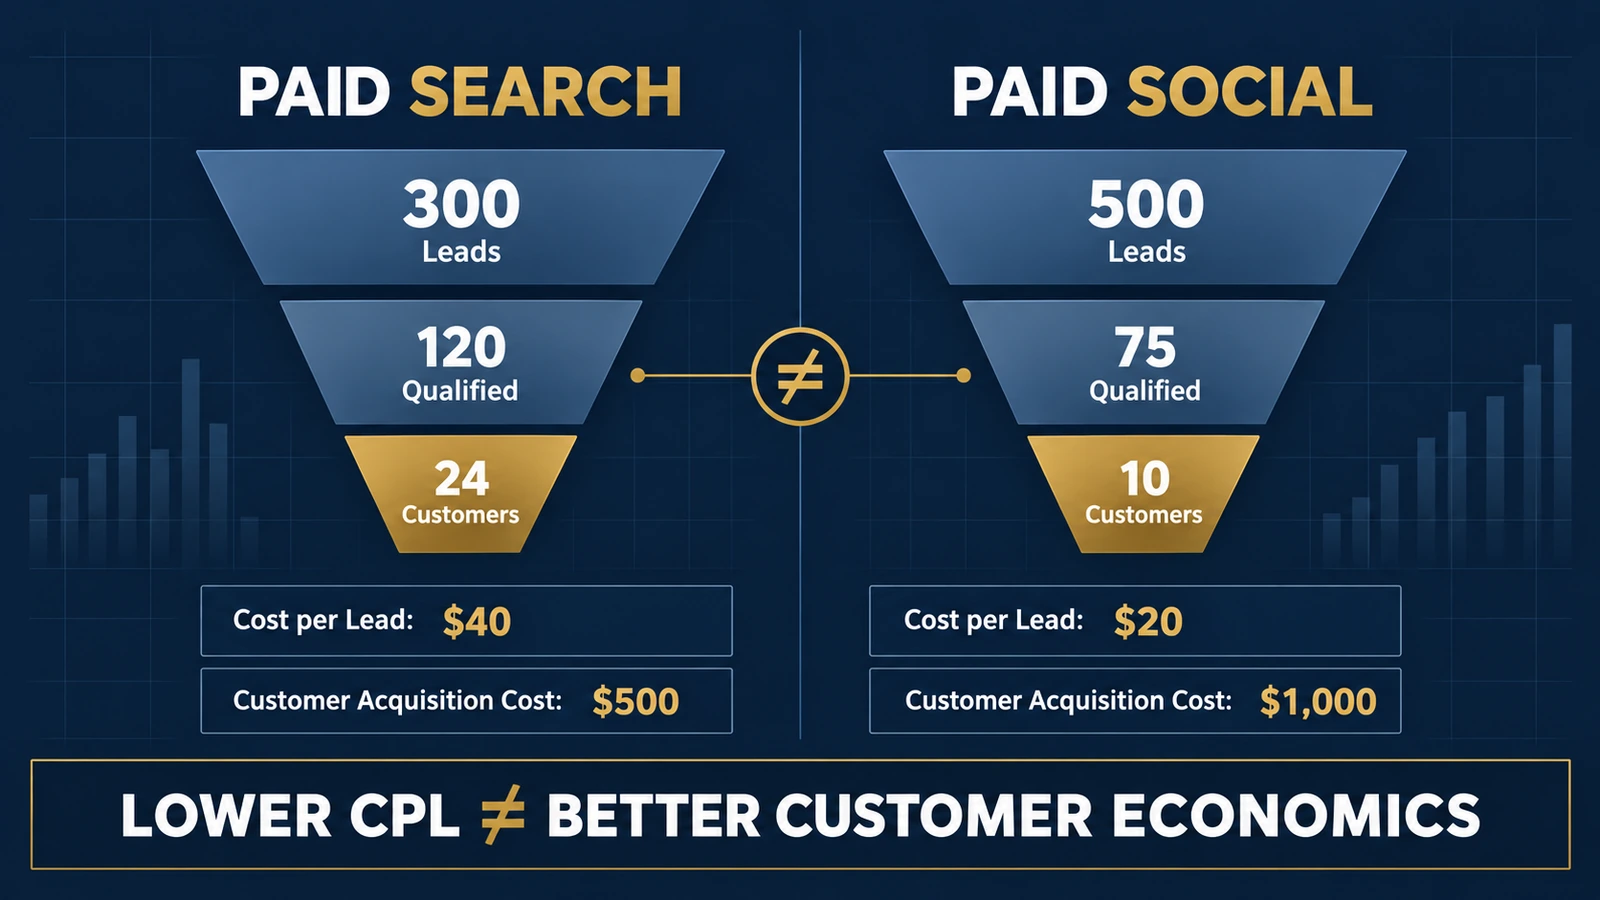
Consider a hypothetical company running two acquisition campaigns. One uses Paid Search. The other uses Paid Social. Both campaigns target the same general product offering. Management wants to determine which channel is generating more economically valuable customers.
Assume the following results have been observed over comparable, sufficiently matured acquisition cohorts.
| Metric | Paid Search | Paid Social |
|---|---|---|
| Advertising spend | $12,000 | $10,000 |
| Leads generated | 300 | 500 |
| Qualified leads | 120 | 75 |
| New customers | 24 | 10 |
These numbers are hypothetical and were constructed to demonstrate the calculations.
Assume that:
- Each lead is counted once.
- Each customer is associated with one canonical lead.
- Qualification criteria are consistent.
- Both cohorts have had sufficient time to mature.
- Advertising costs cover the same acquisition period.
- Customers are not double-counted across channels.
- The channel assignment rule is consistent.
Real organizations must verify these conditions rather than assume they hold.
Step 1: Compare Cost per Lead
Paid Search:
$12,000 / 300
CPL = $40
Paid Social:
$10,000 / 500
CPL = $20
Paid Social appears substantially more efficient. It generates leads at half the cost. If management evaluates performance using only CPL, Paid Social looks like the stronger acquisition channel.
But this is only the first stage of the analysis.
Step 2: Measure Lead Qualification Rates
A lead is not necessarily a qualified prospect. Some leads may be outside the target market. Others may have insufficient budget, lack decision-making authority, or have no realistic purchase intention.
Qualification should be based on documented business criteria rather than arbitrary labels. For example, a business-to-business service provider might define a qualified lead as an organization that:
- Operates in a supported market.
- Has a relevant business need.
- Meets minimum project requirements.
- Provides valid contact information.
- Has a plausible purchasing timeline.
These are illustrative criteria. Actual qualification rules should reflect the company's sales process.
For Paid Search:
120 / 300 = 40%
For Paid Social:
75 / 500 = 15%
| Metric | Paid Search | Paid Social |
|---|---|---|
| Leads | 300 | 500 |
| Qualified leads | 120 | 75 |
| Qualification rate | 40% | 15% |
Paid Social generates more leads. But a much smaller proportion meets the qualification criteria. This changes the economic comparison.
Step 3: Calculate Cost per Qualified Lead
Cost per qualified lead provides a more informative intermediate measure.
Paid Search:
$12,000 / 120
Cost per Qualified Lead = $100
Paid Social:
$10,000 / 75
Cost per Qualified Lead = $133.33
The ranking reverses. Paid Social has the lower CPL. Paid Search has the lower cost per qualified lead.
This does not mean every qualified lead has equal economic value. Qualification is another stage in the funnel, not the final outcome. A qualified prospect may still decide not to purchase. Therefore, the analysis should continue to actual customer acquisition.
Step 4: Compare Lead-to-Customer Conversion
Paid Search:
24 / 300 = 8%
Paid Social:
10 / 500 = 2%
Now examine the conversion rate among qualified leads.
Paid Search:
24 / 120 = 20%
Paid Social:
10 / 75 = 13.33%
| Funnel Metric | Paid Search | Paid Social |
|---|---|---|
| Qualification rate | 40.0% | 15.0% |
| Qualified-to-customer rate | 20.0% | 13.3% |
| Lead-to-customer rate | 8.0% | 2.0% |
These calculations assume that the acquired customers are members of the corresponding qualified-lead groups. Paid Search performs better at both stages. A larger proportion of its leads qualifies, and a larger proportion of qualified leads becomes customers. The difference compounds across the funnel.
Step 5: Calculate Customer Acquisition Cost
Paid Search:
$12,000 / 24
CAC = $500
Paid Social:
$10,000 / 10
CAC = $1,000
| Metric | Paid Search | Paid Social |
|---|---|---|
| Advertising spend | $12,000 | $10,000 |
| Leads | 300 | 500 |
| CPL | $40 | $20 |
| Qualified leads | 120 | 75 |
| Cost per qualified lead | $100 | $133.33 |
| Customers | 24 | 10 |
| Media-only CAC | $500 | $1,000 |
Paid Social generates cheaper leads. But its observed customer acquisition cost is twice as high. The problem is not that CPL was calculated incorrectly. The problem is that CPL answers a different question.
A cheaper lead is not necessarily a cheaper customer.
Why Funnel Conversion Rates Multiply
There is a useful mathematical relationship between CPL, qualification rate, and customer acquisition cost.
Let:
- q = proportion of leads that qualify
- c = proportion of qualified leads that become customers
Then:
For Paid Search:
CPL = $40
q = 0.40
c = 0.20
For Paid Social:
CPL = $20
q = 0.15
c = 10 / 75
This equation explains why CPL optimization can be misleading. Customer acquisition cost depends on both the cost of entering the funnel and the probability of successfully progressing through it.
A campaign may lower CPL by attracting a broader audience. But if that audience is less likely to qualify or purchase, CAC can increase.
The relationship also provides a practical diagnostic framework. When CAC rises, investigate whether the change comes from higher lead acquisition costs, lower qualification rates, lower sales conversion rates, or a combination of these factors.
How Much Would Paid Social Need to Improve?
Suppose management wants Paid Social to achieve a media-only CAC of $500. Its CPL remains $20. Its qualified-to-customer conversion rate remains approximately 13.33%.
What qualification rate would be required?
Start with:
Rearrange:
Substitute:
Paid Social would need to increase its qualification rate from 15% to 30%, assuming the qualified-to-customer conversion rate and CPL remain unchanged.
At 500 leads:
30% qualified = 150 qualified leads
At the assumed qualified-to-customer rate:
150 × (10/75) = 20 customers
CAC:
$10,000 / 20 = $500
This is a useful target calculation. But it is not a forecast. Improving qualification rates may change CPL, audience composition, sales conversion, and campaign volume. A company cannot assume that one funnel metric can be doubled while every other variable remains constant.
The calculation identifies the conditions required to reach the target. Whether those conditions are achievable requires additional evidence.
Lower CAC Is Not Automatically Higher Profit
Customer acquisition cost is an important financial metric. But the economic value of a customer also matters.
Suppose the company expects each acquired customer to generate $1,000 of contribution over the first 12 months, before acquisition spending. This is a hypothetical contribution estimate. It is not necessarily customer lifetime value. The $1,000 should represent revenue minus relevant variable costs over the specified horizon.
Assume the contribution estimate is the same for customers from both channels.
| Metric | Paid Search | Paid Social |
|---|---|---|
| Customers | 24 | 10 |
| Contribution per customer | $1,000 | $1,000 |
| Contribution before advertising | $24,000 | $10,000 |
| Advertising spend | $12,000 | $10,000 |
| Contribution after advertising | $12,000 | $0 |
Under these assumptions, Paid Search has stronger observed acquisition economics. However, these figures are not necessarily incremental profit. They do not establish how many customers would have purchased without the campaigns. They also exclude acquisition expenses beyond advertising. The calculations describe the economics associated with the measured customer cohorts. Causal claims require additional evidence.
Why Lead Cohorts Matter More Than Calendar-Month Totals
Advertising spending, lead creation, qualification, and customer acquisition occur at different times. A lead generated in January may become a customer in March. If management compares January advertising spending with January closed sales, it may be combining different groups of customers.
The numerator and denominator do not necessarily describe the same acquisition cohort. This can make CAC difficult to interpret.
| Lead Cohort | Leads | Customers by Day 30 | Customers by Day 60 | Customers by Day 90 |
|---|---|---|---|---|
| January | 200 | 8 | 15 | 20 |
| February | 200 | 10 | 16 | Not yet observed |
Assume the January cohort has completed 90 days of follow-up. The February cohort has completed only 60 days. It would be misleading to conclude that February performed worse based on those two numbers.
A fair comparison could examine both cohorts at 60 days.
January:
15 / 200 = 7.5%
February:
16 / 200 = 8.0%
At the same 60-day horizon, February has a slightly higher observed conversion rate. Its eventual 90-day result remains unknown.
This is an example of incomplete outcome observation, sometimes called right-censoring. For many practical marketing reports, a straightforward solution is to compare only cohorts that have completed the same follow-up window. For more complex sales processes, survival analysis or other time-to-event methods may be appropriate.
The important principle is:
Compare acquisition cohorts at equivalent stages of maturity.
Do not interpret immature leads as failed leads simply because they have not yet had enough time to convert.
A Practical SQL Example: Measuring 90-Day Lead Conversion
A business with a CRM database can construct a cohort-based conversion report.
Consider a simplified PostgreSQL schema.
Table: crm_leads
Fields: lead_id, acquired_at, channel, is_test
Table: crm_opportunities
Fields: opportunity_id, lead_id, stage, closed_at
Assume that lead_id uniquely identifies a canonical lead; acquired_at is the lead acquisition timestamp; closed_at is the opportunity closing timestamp; both timestamps use consistent time-zone handling; a lead is considered converted if at least one associated opportunity is closed-won within 90 days; test leads are excluded; and a lead counts only once, even if multiple opportunities exist.
WITH eligible_leads AS (
    SELECT
        lead_id,
        channel,
        acquired_at,
        DATE_TRUNC(
            'month',
            acquired_at AT TIME ZONE 'UTC'
        )::date AS cohort_month
    FROM crm_leads
    WHERE is_test = FALSE
      AND acquired_at <=
          CURRENT_TIMESTAMP - INTERVAL '90 days'
),

lead_outcomes AS (
    SELECT
        l.lead_id,
        l.channel,
        l.cohort_month,
        EXISTS (
            SELECT 1
            FROM crm_opportunities o
            WHERE o.lead_id = l.lead_id
              AND o.stage = 'closed_won'
              AND o.closed_at >= l.acquired_at
              AND o.closed_at <
                  l.acquired_at + INTERVAL '90 days'
        ) AS converted_90d
    FROM eligible_leads l
)

SELECT
    cohort_month,
    channel,
    COUNT(*) AS leads,
    COUNT(*) FILTER (
        WHERE converted_90d
    ) AS customers_90d,
    ROUND(
        100.0 * COUNT(*) FILTER (
            WHERE converted_90d
        ) / NULLIF(COUNT(*), 0),
        2
    ) AS conversion_rate_90d_pct
FROM lead_outcomes
GROUP BY
    cohort_month,
    channel
ORDER BY
    cohort_month,
    channel;
The query is illustrative. It should be adapted to the organization's actual CRM structure.
The EXISTS condition prevents multiple closed-won opportunities from multiplying the lead count. The 90-day eligibility condition excludes leads that have not completed the required observation period. The query measures conversion within 90 elapsed days of acquisition, not eventual lifetime conversion.
It also assumes that a converted lead represents one acquired customer. That assumption may not hold in every CRM. For example, multiple contacts may belong to one purchasing organization, a single customer may generate multiple leads, and one opportunity may involve several contacts.
A production implementation should define the canonical customer identifier and the relationship between leads, opportunities, accounts, and customers. Otherwise, a technically valid query can still produce a misleading acquisition metric.
How to Connect Website Leads With CRM Outcomes
Many businesses collect marketing interactions through web analytics while storing sales outcomes in a CRM. This creates a measurement gap.
The website knows that a form was submitted. The CRM knows whether the lead qualified and eventually became a customer. But unless the systems can connect those events, marketing reporting may stop at the form submission.
A useful measurement architecture connects five stages.
- Acquisition. Record the relevant campaign and traffic context, such as campaign identifiers, source, medium, and other appropriate acquisition information.
- Lead Creation. Create a unique lead record after a valid submission or inquiry. Prevent accidental duplicate submissions from being counted as separate leads.
- Qualification. Record whether the lead meets documented qualification criteria. Capture qualification dates and, where appropriate, disqualification reasons.
- Sales Outcome. Connect the lead to the relevant opportunity or customer record. Record the outcome and timestamp.
- Financial Measurement. Connect acquired customers to relevant revenue, contribution, or other business outcomes.
This structure allows analysts to move beyond “Which campaign generated the most forms?” toward “Which campaign generated customers with economically valuable outcomes?”
Where GA4 Fits Into Lead Measurement
Google Analytics 4 provides recommended events for measuring lead-generation activity. Examples include generate_lead when a lead is generated, qualify_lead when a lead meets the defined qualification criteria, disqualify_lead when a lead is disqualified, working_lead when the lead enters an active sales interaction, and close_convert_lead when the lead becomes a converted customer.
These event names provide a useful measurement vocabulary. However, the events are not automatically available merely because GA4 is installed. They require appropriate implementation and data collection.
An organization must also ensure that event definitions match its actual business process. Clicking a contact button is not necessarily equivalent to submitting a valid lead. A form submission is not necessarily equivalent to a qualified prospect. And a qualified prospect is not necessarily equivalent to an acquired customer.
For the official event definitions, see Google's recommended events documentation for lead generation.
The objective is not to send every possible event. It is to capture meaningful transitions in the customer journey.
What About Offline Conversion Tracking?
In many businesses, the final conversion occurs outside the website. A customer may submit a form, speak with a sales representative, attend a consultation, receive a proposal, and sign a contract weeks later.
A website analytics system may observe only the initial interaction. Offline conversion measurement attempts to connect subsequent CRM outcomes with eligible advertising interactions.
Google Ads supports enhanced conversions for leads, which can use appropriately collected and processed first-party customer information to improve conversion matching. Google's documentation on enhanced conversions for leads explains the relationship between website lead information, CRM outcomes, and advertising conversion measurement.
Implementation should follow current platform requirements, privacy obligations, consent settings, and applicable data-protection rules. A business should not send raw private CRM records or unnecessary personal information into analytics systems.
Offline conversion measurement can improve the connection between advertising interactions and later sales outcomes. But it does not automatically establish that advertising caused those sales. That distinction remains important.
Attribution Is Not the Same as Incrementality
Suppose Paid Search is associated with 24 customers. That does not prove all 24 customers were acquired because of Paid Search. Some customers may already have intended to purchase. Others may have interacted with multiple marketing channels.
An attribution model assigns credit according to an established measurement framework. A causal analysis asks a different question: how many additional customers would the company have acquired if the campaign had not run?
That question requires a counterfactual comparison. Randomized experiments, carefully designed geographic tests, or other defensible causal methods may help estimate incremental impact.
This distinction is explored in UAD Consulting's article on marketing attribution versus incrementality.
For the worked example in this article, the observed acquisition economics are useful descriptive measures. They should not be interpreted as experimentally established incremental returns.
The correct conclusion is: Paid Search has lower observed media-only CAC and stronger acquisition-associated contribution under the stated assumptions. The example does not prove that increasing Paid Search spending will cause proportionally more profitable customer acquisition.
Why the Cheapest Channel May Not Deserve the Next Dollar
Even if Paid Search has a lower observed CAC, management should not automatically transfer the entire marketing budget to it.
The channel may have limited additional demand. Its most responsive audience may already be reached. Additional spending may require more expensive keywords or less qualified traffic.
As spending increases, acquisition costs can change. This creates a distinction between historical average performance and the expected performance of additional investment.
A channel with a $500 historical CAC may have a much higher CAC on the next budget increment. Another channel with a $1,000 historical CAC may improve through better targeting, qualification, or creative changes.
The decision therefore requires both historical acquisition economics and expected marginal performance. UAD Consulting's article on marginal ROAS and diminishing marketing returns examines this broader budget-allocation problem.
Five Common Mistakes in Lead-Generation Reporting
1. Counting Every Form Submission as a Unique Lead
A visitor may submit the same form multiple times. A tracking tag may also fire more than once. Without deduplication, reported lead volume can be inflated.
2. Comparing Immature Lead Cohorts
A campaign launched last week has not had the same opportunity to generate closed sales as a campaign launched three months ago. Comparisons should account for sales-cycle maturity.
3. Using Inconsistent Qualification Definitions
One team may classify a lead as qualified after a form submission. Another may require a sales conversation. A third may require confirmed budget and purchasing authority. Without a shared definition, qualification rates are not comparable.
4. Ignoring Customer Economics
Two channels may have similar CAC but generate customers with different expected contribution, retention, or service costs. The acquisition decision should consider the economic value of customers, not only their acquisition cost.
5. Treating Attributed Customers as Incremental Customers
Observed customer acquisition and causally incremental acquisition are different concepts. Attribution can describe relationships between marketing interactions and conversions. It does not automatically establish causal impact.
What Should a Lead-Generation Dashboard Include?
A useful lead-generation dashboard should connect marketing activity to downstream outcomes.
| Measurement Layer | Core Metrics | Business Question |
|---|---|---|
| Acquisition | Spend, clicks, CPL | How efficiently are we generating leads? |
| Qualification | Qualified leads, qualification rate, cost per qualified lead | Are we attracting relevant prospects? |
| Sales | Opportunities, win rate, time to close | Are leads progressing through the sales process? |
| Customer Acquisition | New customers, media-only CAC, fully loaded CAC | What does acquiring a customer cost? |
| Economics | Contribution, customer value, acquisition-associated margin | Are acquired customers economically valuable? |
| Measurement Quality | Match rate, missing source data, duplicate leads, cohort maturity | Can we trust the comparison? |
These metrics should not necessarily appear on one crowded screen. An executive dashboard may emphasize a few decision-relevant outcomes. Analysts should be able to investigate the underlying funnel stages.
A mature measurement system also documents metric definitions, data sources, attribution rules, lead identity rules, reporting time zones, cohort maturity, qualification criteria, cost inclusions, and known limitations.
The goal is not to create more metrics. It is to make the existing metrics more useful for decisions.
A Practical Lead-Quality Measurement Audit
Before changing campaign budgets, a company can perform a focused audit.
- Verify that lead-generation events represent valid submissions rather than button clicks or duplicate tracking events.
- Establish a canonical lead identifier.
- Document qualification criteria.
- Connect leads to CRM outcomes.
- Calculate conversion rates using consistent acquisition cohorts.
- Separate advertising-only acquisition costs from fully loaded acquisition costs.
- Connect acquired customers to an appropriate financial outcome.
- Evaluate whether differences persist across meaningful customer segments.
- Distinguish descriptive campaign performance from causal evidence about incremental acquisition.
This audit can reveal whether the apparent problem comes from tracking errors, audience quality, sales conversion, reporting timing, attribution differences, or customer economics.
Different causes require different responses. A tracking problem requires measurement correction. A qualification problem may require audience or messaging changes. A sales conversion problem may require examining the sales process. A customer economics problem may require reconsidering acquisition targets.
The same dashboard symptom can have several explanations.
The Real Question Is Not How Cheaply You Generate Leads
Return to the original example. Paid Social generated 500 leads at $20 each. Paid Search generated 300 leads at $40 each. Paid Social looked more efficient at the top of the funnel.
But Paid Search generated 24 customers, compared with 10 from Paid Social. Its observed media-only CAC was $500 rather than $1,000. Under the hypothetical contribution assumptions, Paid Search also produced stronger acquisition-associated financial outcomes.
The lesson is not that Paid Search is universally better than Paid Social. The lesson is that the ranking of marketing channels can change when the outcome being measured changes.
CPL measures the cost of generating leads. Cost per qualified lead measures the cost of generating prospects who meet defined criteria. CAC measures acquisition spending relative to acquired customers. Contribution-based analysis connects those customers to business economics. And causal measurement asks whether marketing actually generated additional customers.
These are related but different questions.
The purpose of lead-generation analytics is not to minimize the cost of a form submission. It is to help a business acquire economically valuable customers using evidence it can trust.
Organizations that need to connect these measurement layers can explore UAD Consulting's marketing and digital analytics.
References and Further Reading
Connect Marketing Leads to Business Outcomes
UAD Consulting helps organizations connect marketing activity with qualified leads, customer acquisition, and financial outcomes. From GA4 and GTM measurement to CRM data integration, funnel analysis, and marketing performance evaluation, the goal is to make acquisition decisions more informed.
Explore ServicesGet in Touch