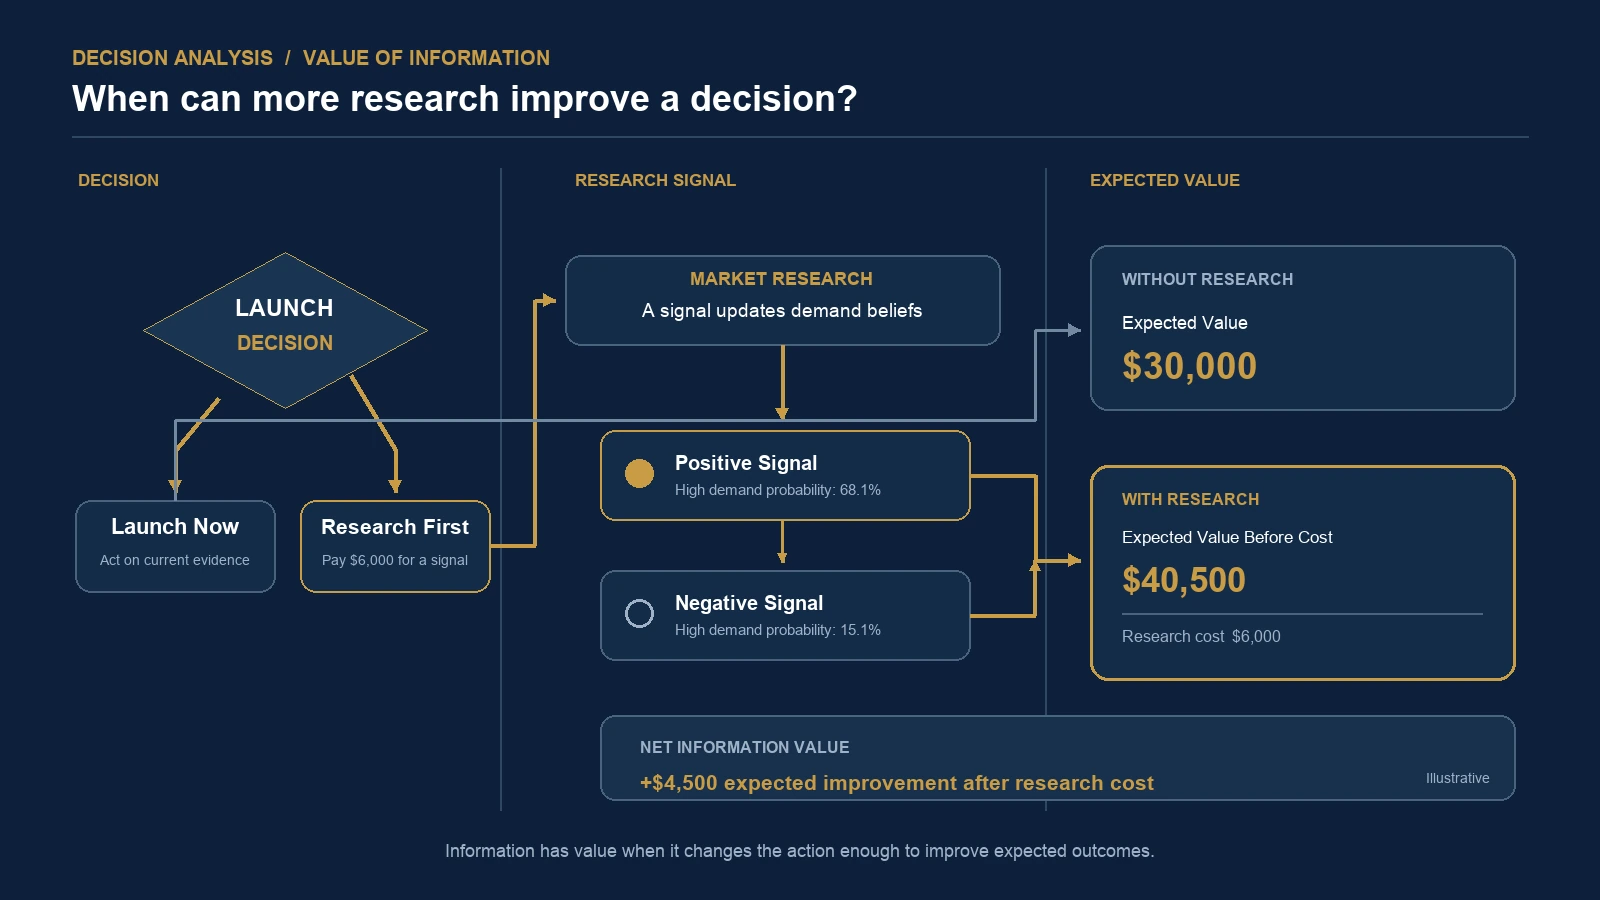
A company is considering launching a new product.
Management has already analyzed historical sales, customer behavior, competitors, and estimated demand.
The opportunity looks promising.
But there is uncertainty.
If demand is strong, the launch could generate a substantial profit.
If demand is weak, the company could lose money.
A research agency offers to conduct an additional market study for $6,000.
The agency argues that the study will improve the company's understanding of demand.
Management now faces a different question from the original launch decision:
Is better information worth $6,000?
This question appears across business analytics, marketing, operations, healthcare, and investment planning.
Companies routinely purchase research, build predictive models, commission surveys, run pilots, and collect additional data.
But more information is not automatically worth its cost.
The value depends on whether the information is likely to change a decision—and whether that change improves the expected outcome enough to justify the investment.
Decision analysis provides a framework for answering this question.
It is called value-of-information analysis.
What Is the Value of Information?
The value of information is the expected improvement in decision outcomes that becomes possible when additional information is available.
The key word is decision.
Information is not valuable simply because it reduces uncertainty.
It is valuable when reducing uncertainty allows a decision-maker to select a better action.
Consider two situations.
In the first, management is uncertain about demand, but the company would launch the product regardless of the research result.
In the second, management would launch after a favorable result but cancel the project after an unfavorable result.
The second situation creates a clearer opportunity for information to improve the decision.
This leads to a practical principle:
The value of information depends on how the information changes the action, not merely on how accurately it predicts an outcome.
Two commonly used measures are:
- Expected Value of Perfect Information (EVPI)
- Expected Value of Sample Information (EVSI)
EVPI considers a hypothetical situation in which uncertainty is completely resolved before the decision.
EVSI evaluates the expected benefit of a specific, imperfect information-gathering process.
The distinction is important because real-world research is rarely perfect.
Step 1: Define the Business Decision Before Buying More Data
Suppose a company is considering a one-time product launch.
Management has two options:
- Launch the product.
- Do not launch.
There are two possible demand conditions:
- High demand
- Low demand
Based on existing evidence, management estimates:
Probability of high demand: 40%
Probability of low demand: 60%
The estimated incremental financial outcomes are:
| Decision | High Demand | Low Demand |
|---|---|---|
| Launch | +$150,000 | -$50,000 |
| Do not launch | $0 | $0 |
These are hypothetical values created to illustrate the method.
They are not estimates from a real company.
Assume the payoffs already include relevant launch costs and are measured over the same decision horizon.
Also assume that management is evaluating a single opportunity, probabilities are reasonably specified, and expected financial value is an appropriate decision criterion.
We will revisit these assumptions later.
Calculate the Expected Value of Launching
Expected value is the probability-weighted average of possible outcomes.
For the launch decision:
The expected value of not launching is:
$0
Therefore, under the stated assumptions, launching is the preferred decision.
This does not mean the company will earn exactly $30,000.
The actual modeled outcome is either a $150,000 gain or a $50,000 loss.
The $30,000 figure is the expected value across those possible outcomes.
It is useful for comparing decisions, but it does not eliminate risk.
Step 2: Calculate the Expected Value of Perfect Information
Now imagine the company could learn with certainty whether demand would be high or low before committing to the launch.
With perfect information, management would:
- Launch if demand will be high.
- Avoid launching if demand will be low.
The expected value under perfect information would be:
= $60,000
The best expected value with current information is $30,000.
Therefore:
What does this mean?
Under the model's assumptions, completely resolving uncertainty before making the launch decision would improve expected financial outcomes by $30,000.
That is the expected value of perfect information.
It also provides an upper bound on the expected gross benefit of an ordinary information-gathering exercise that addresses the same uncertainty.
A market study that provides only imperfect information cannot be expected to outperform genuinely perfect information when the decision opportunities and other conditions are the same.
Therefore, spending more than $30,000 solely to obtain information about this decision would not be justified under the risk-neutral model.
But $30,000 is not the amount the company should automatically spend.
Real research is imperfect.
To evaluate an actual study, we need a different calculation.
Step 3: Evaluate an Imperfect Market Research Study
Suppose a research agency offers a study that produces one of two signals:
Positive signal: Demand is likely to be high.
Negative signal: Demand is likely to be low.
The agency estimates that its method has the following characteristics:
Sensitivity: 80%
If demand will actually be high, the study produces a positive signal 80% of the time.
Specificity: 75%
If demand will actually be low, the study produces a negative signal 75% of the time.
These performance values are hypothetical.
A real project would require evidence supporting them.
They should not be accepted merely because a research vendor reports a headline accuracy score.
Build the Joint Probability Table
We already know:
The study has:
Multiplying the conditional probabilities by the prior probabilities gives:
| Actual Demand | Positive Signal | Negative Signal | Total |
|---|---|---|---|
| High demand | 0.32 | 0.08 | 0.40 |
| Low demand | 0.15 | 0.45 | 0.60 |
| Total | 0.47 | 0.53 | 1.00 |
For example:
P(High Demand AND Positive Signal)
= 0.32
Likewise:
P(Low Demand AND Positive Signal)
= 0.15
Therefore:
The table describes the joint probability distribution implied by the model assumptions.
It is not a table of observed research results.
Step 4: Update the Probability of High Demand After Each Signal
Before receiving the study, management estimates a 40% probability of high demand.
After receiving a positive signal, that probability changes.
Using Bayes' rule:
P(High Demand | Positive)
Probability of High Demand After a Positive Signal: 68.1%
Now consider a negative signal.
P(High Demand | Negative)
Probability of High Demand After a Negative Signal: 15.1%
The study therefore changes management's assessment of demand.
Before research: 40.0%
After positive research: 68.1%
After negative research: 15.1%
But changing a probability estimate is not enough.
We still need to determine whether these updated probabilities change the preferred action.
Step 5: Find the Probability Threshold for Launching
Let p represent the probability of high demand.
The expected value of launching is:
Simplifying:
The company should prefer launching over the zero-payoff alternative when:
Therefore:
The launch decision threshold is 25%.
If the probability of high demand exceeds 25%, launching has a positive expected financial value.
If it falls below 25%, not launching has the higher expected financial value.
This threshold comes from the economic consequences of the two demand outcomes.
It is not an arbitrary 50% classification threshold.
That distinction matters.
A model can predict that high demand is less likely than low demand while launching remains the preferred financial decision.
Apply the Research Results
After a positive signal:
This exceeds the 25% threshold.
Decision: Launch.
After a negative signal:
This is below the 25% threshold.
Decision: Do not launch.
The research is now potentially valuable because it changes the recommended action depending on the result.
Without research: Launch.
With research: Launch after a positive signal. Do not launch after a negative signal.
We can now calculate how much that flexibility is worth.
Step 6: Calculate the Expected Value of Sample Information
Expected Value of Sample Information, or EVSI, measures the expected improvement in decision outcomes from obtaining a specified imperfect signal before choosing an action.
The calculation must consider every possible research result and the optimal decision after that result.
Positive-Signal Branch
A positive signal can occur in two ways:
Management launches after a positive signal.
The unconditional contribution from that branch is:
= $40,500
Negative-Signal Branch
A negative signal can occur in two ways:
Management does not launch after a negative signal.
The financial payoff is zero in either demand state.
Therefore:
Total Expected Value With Research
This is the expected value before deducting the cost of conducting the research.
Without research, the preferred decision had an expected value of $30,000.
Therefore:
The research is expected to improve the financial outcome of the launch decision by $10,500 before research costs.
This is the expected gross value of the information.
Compare EVSI With EVPI
We calculated:
The proposed study captures:
of the modeled value of perfect information.
This does not mean the study is 35% accurate.
It means that, under these assumptions, the study captures 35% of the expected decision improvement theoretically available from perfect information.
Prediction accuracy and economic value are different concepts.
Step 7: Subtract the Cost of Research
The research agency charges:
$6,000
The expected gross value of the research is:
$10,500
Therefore:
Under the assumptions of this example, conducting the research is economically justified.
The decision comparison is:
| Strategy | Expected Value |
|---|---|
| Launch immediately | $30,000 |
| Obtain research, then choose | $40,500 |
| Research cost | -$6,000 |
| Research strategy after cost | $34,500 |
| Net expected improvement | +$4,500 |
The analysis supports purchasing the research.
However, the conclusion is conditional on the model.
It assumes that the research arrives before the launch decision, does not materially change the demand environment, and has the stated predictive characteristics.
It also assumes no additional material costs or consequences from waiting.
Those assumptions deserve scrutiny.
Why Research Accuracy Is Not the Same as Research Value
Suppose a research vendor improves its forecasting model.
Its sensitivity increases.
Its specificity increases.
Its overall classification accuracy improves.
Does that automatically justify a higher research fee?
No.
The economic value depends on how the improved signal changes the decision.
Imagine that management would launch regardless of whether the research result was positive or negative.
If the information cannot change the action, the expected value of that information for this specific decision is zero.
That remains true even if the research produces an impressive prediction.
Conversely, a moderately accurate signal can be valuable if it reliably identifies situations in which management should avoid a costly mistake.
The important distinction is:
Predictive performance measures how well a signal separates outcomes. Decision value measures how much using that signal improves expected results.
This principle also applies to machine learning.
A predictive model can have a strong AUC while providing little incremental economic value if its predictions do not alter an operational decision.
The relationship between prediction and action is explored further in UAD Consulting's article on predictive analytics to decision-making.
Sensitivity Analysis: What If the Research Is Less Reliable?
The original analysis assumed:
These assumptions determine the estimated EVSI.
We should test whether the recommendation changes when they change.
Scenario A: Lower Specificity
Suppose sensitivity remains 80%, but specificity falls to 60%.
The probability of a positive signal under low demand rises from 25% to 40%.
The positive-signal branch now contains:
The expected contribution from launching after a positive signal becomes:
= $36,000
Under these assumptions, the optimal policy remains to launch after a positive signal and not launch after a negative signal.
The expected value without research remains $30,000.
Therefore:
After the $6,000 research cost:
The research no longer offers a positive expected financial advantage.
Scenario B: Lower Sensitivity
Now suppose:
The positive-signal branch becomes:
Expected contribution:
= $34,500
Again, the optimal policy is to launch after a positive signal and not launch after a negative signal.
After the $6,000 research cost:
Under this revised assumption, buying the research is no longer economically attractive.
Compare the Results
| Research Assumption | EVSI | Research Cost | Net Benefit |
|---|---|---|---|
| 80% sensitivity, 75% specificity | $10,500 | $6,000 | +$4,500 |
| 80% sensitivity, 60% specificity | $6,000 | $6,000 | $0 |
| 70% sensitivity, 75% specificity | $4,500 | $6,000 | -$1,500 |
These calculations reveal something important.
The research investment is sensitive to assumptions about signal reliability.
Before purchasing the study, management should ask how the vendor established those performance estimates.
Were they evaluated on independent historical cases?
Are the cases representative of the current market?
Were the evaluation methods appropriate?
Could the research results become less reliable when market conditions change?
The answer may determine whether the study is worth purchasing.
A Research Study Can Be Valuable Even When It Does Not Confirm the Original Forecast
Managers sometimes evaluate research by asking whether it confirmed their expectations.
That is not the correct standard.
Suppose the company expects high demand and plans to launch.
The research returns a negative signal.
Management cancels the launch.
Later, demand turns out to have been low.
The study helped avoid a $50,000 loss.
But that does not mean every negative research result is valuable or correct.
Some negative signals will occur even when demand would have been high.
The decision must therefore be evaluated across the complete distribution of possible outcomes.
That is why EVSI is calculated before the research result is known.
The method measures the expected benefit of following a decision policy informed by research, not the benefit of one favorable historical outcome.
Research Can Lose Value When Decisions Are Delayed
The worked example assumes that conducting research does not affect the opportunity itself.
Real businesses rarely operate under that assumption perfectly.
A market study might take six weeks.
During that period:
- A competitor could enter the market.
- Customer preferences could change.
- A supplier discount could expire.
- A seasonal sales opportunity could disappear.
- Financing costs could increase.
- Product development could be delayed.
These consequences should be incorporated into the decision model when material.
For example, if delaying the launch creates an additional expected economic cost of $7,000, the original $4,500 net expected benefit becomes:
Under that revised assumption, the research strategy would no longer be preferred.
This is why a practical research decision should consider:
Expected Information Benefit
minus
Direct Research Cost
minus
Relevant Delay and Implementation Costs
The correct comparison is between complete decision strategies, not simply between a research fee and a forecast accuracy metric.
When Is the Expected Value of Information Zero?
Additional information can have little or no decision value in several situations.
The Decision Would Never Change
If management would launch regardless of the research result, the information does not improve the decision under the modeled objective.
The Information Arrives Too Late
Research that becomes available after an irreversible decision may have no value for that decision.
It may still be useful for future decisions.
The Signal Does Not Reduce Relevant Uncertainty
A survey that measures brand awareness may not help resolve uncertainty about production costs.
The information must address variables capable of changing the preferred action.
The Decision Is Already Robust
Suppose one strategy remains superior across all plausible parameter values.
Further research may refine estimates without changing the recommendation.
The Research Is Too Expensive
Even useful information may cost more than its expected benefit.
The correct conclusion is not that research is useless.
It is that this particular research investment is not economically justified for the specified decision.
How Value-of-Information Analysis Connects to Healthcare Economics
Value-of-information analysis is especially relevant in health economics and outcomes research.
Healthcare decision-makers often face uncertainty about:
- Treatment effectiveness
- Adverse event rates
- Patient eligibility
- Long-term outcomes
- Healthcare utilization
- Costs
- Quality-adjusted life years
- Treatment adherence
A new intervention may appear cost-effective under current evidence.
However, uncertainty about its clinical effects or long-term costs may influence whether adoption is the preferred strategy.
Decision-makers may need to determine whether additional clinical research is worth funding before implementation.
The International Society for Pharmacoeconomics and Outcomes Research, or ISPOR, has published methodological guidance on value-of-information analysis. Its guidance distinguishes measures including Expected Value of Perfect Information, Expected Value of Partial Perfect Information, Expected Value of Sample Information, and Expected Net Benefit of Sampling [1, 2].
These methods can help evaluate whether additional research is worthwhile and which uncertainties deserve attention.
The mathematical principle is closely related to the business launch example.
However, healthcare applications may require more complex decision models, longer time horizons, population-level consequences, health outcomes, and explicit treatment of uncertainty.
The $30,000 and $10,500 results from our business example should not be interpreted as healthcare estimates.
They are illustrative calculations showing the underlying logic.
Value of Information Is Not a Causal Effect Estimate
A distinction is necessary when applying this framework to marketing, healthcare, and operational interventions.
A research signal can predict an outcome without establishing what would happen if management changed an intervention.
For example:
A survey might identify customers likely to cancel a subscription.
That information does not establish that offering those customers a discount will prevent cancellation.
The survey predicts churn risk.
It does not necessarily estimate the causal effect of a retention offer.
Likewise, a market research study might predict strong demand.
That does not establish that increasing advertising expenditure will cause a proportional increase in sales.
A value-of-information model can use predictive probabilities as inputs.
But if the decision involves changing an intervention, the model also needs defensible estimates of the consequences of that action.
Those estimates may require experiments, quasi-experimental designs, causal modeling, or other appropriate evidence.
Decision analysis does not turn correlation into causation.
It organizes the available evidence and assumptions to compare actions.
If the underlying causal assumptions are wrong, the resulting recommendation can also be wrong.
How to Apply Value-of-Information Analysis in a Real Business
A practical implementation does not necessarily require an elaborate simulation model.
For a relatively simple decision, a spreadsheet and a transparent decision tree may be sufficient.
A useful workflow has seven stages.
1. Define the Decision
Identify the actual alternatives.
For example:
Launch now.
Conduct research, then decide.
Cancel the project.
2. Identify the Uncertainty
Determine which uncertain outcomes materially influence the preferred action.
Do not model every available variable simply because it exists.
3. Estimate the Payoffs
Calculate the relevant economic consequences of each action under each outcome.
Use consistent time horizons and comparable definitions.
4. Establish Current Probabilities
Use available data, forecasts, research, or carefully documented expert judgment.
Distinguish evidence-based estimates from assumptions.
5. Calculate the Current Best Decision
Find the action with the highest expected value or another appropriate decision objective.
6. Model the Additional Information
Estimate what the proposed research could reveal.
Evaluate how different results would update probabilities and alter the recommended action.
7. Compare Information Value With Cost
Calculate the expected improvement from research.
Subtract relevant direct costs, delay costs, and implementation consequences.
Then perform sensitivity analysis.
This workflow moves research planning from:
"We should collect more data."
to:
"Which information could change our decision, and what is that information worth?"
When Should a Business Use a More Advanced Model?
The worked example contains two decisions, two demand states, and two possible research signals.
That makes it possible to calculate EVSI directly.
More complex decisions may involve:
- Multiple competing investments
- Several uncertain market conditions
- Correlated uncertainties
- Sequential decisions
- Repeated research opportunities
- Complex customer behavior
- Long-term costs and benefits
- Nonlinear financial outcomes
- Operational constraints
In those situations, analysts may use decision trees, probabilistic models, Monte Carlo simulation, or specialized value-of-information methods.
For example, a healthcare economic model may require simulation to estimate the expected value of additional clinical evidence.
A manufacturing company may need to model how research affects several production and capacity decisions.
The complexity should be justified by the decision.
A sophisticated model is not automatically more useful than a transparent calculation.
The appropriate method is the simplest defensible model that captures the uncertainties and consequences capable of changing the decision.
For a broader comparison of uncertainty methods, see UAD Consulting's article on scenario analysis and Monte Carlo simulation. Organizations working through a more complex decision structure can also explore simulation and decision modeling.
The Most Important Question Before Collecting More Data
Organizations often begin analytical projects by asking:
What additional data can we collect?
What model should we build?
How accurate can the forecast become?
Those questions can be useful.
But they should follow a more fundamental question:
What decision would we make differently if we knew more?
If the answer is unclear, the value of additional research may also be unclear.
In our hypothetical product launch example:
The best decision without research produced an expected value of $30,000.
Perfect information had an expected value of $30,000 above that baseline.
A specific imperfect research study increased expected decision value by $10,500.
After paying $6,000 for the study, the expected net benefit was $4,500.
But modest changes to the assumed research accuracy could eliminate that benefit.
The calculation did not simply demonstrate that research is valuable.
It demonstrated the conditions under which research becomes valuable.
The purpose of better information is not to eliminate uncertainty at any cost. It is to improve decisions by more than the information costs to obtain.
References and Further Reading
- Fenwick E, Steuten L, Knies S, et al. (2020). Value of Information Analysis for Research Decisions—An Introduction. Value in Health, 23(2), 139–150.
- Rothery C, Strong M, Koffijberg H, et al. (2020). Value of Information Analytical Methods. Value in Health, 23(3), 277–286.
- National Research Council (2013). Environmental Decisions in the Face of Uncertainty. National Academies Press.
- Kunst N, Wilson ECF, Glynn D, et al. (2020). Computing the Expected Value of Sample Information Efficiently: Practical Guidance and Recommendations for Four Model-Based Methods. Value in Health, 23(6), 734–742.
Make Better Decisions Before Investing in More Data
UAD Consulting helps organizations evaluate uncertainty, compare business alternatives, build decision models, and determine which analytical investments can meaningfully improve outcomes.
Explore ServicesGet in Touch