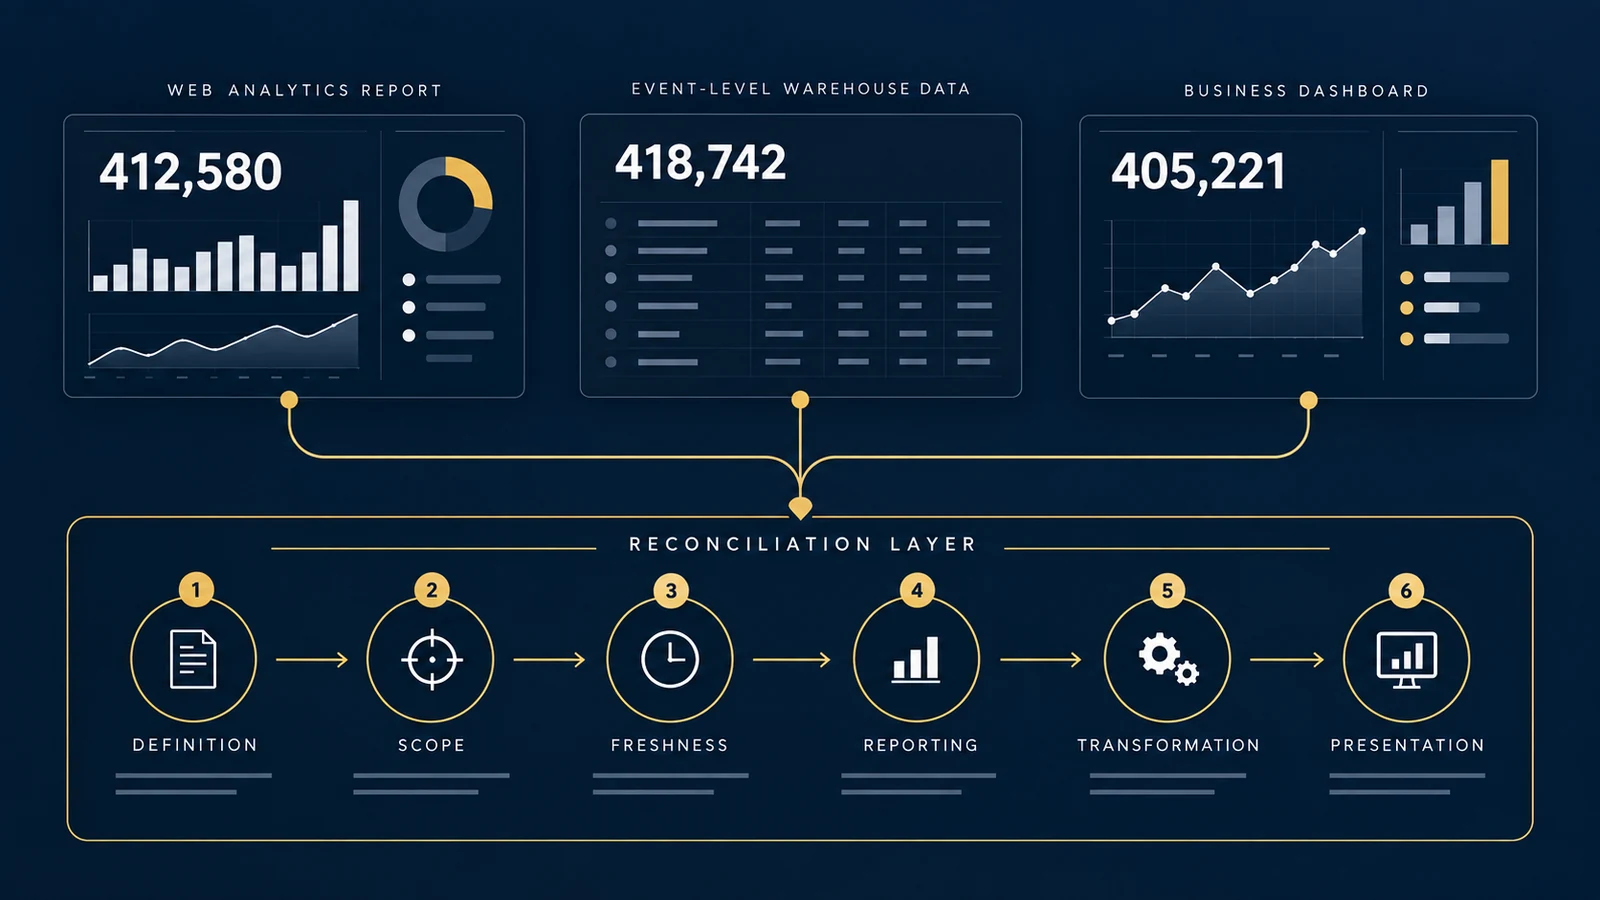
A marketing team opens its weekly dashboard and sees 12,480 sessions.
An analyst queries the same date range in BigQuery and gets 12,731. Someone checks a GA4 Exploration and finds another number.
The immediate reaction is often: Which number is wrong?
Sometimes one of them is wrong. But disagreement between analytics surfaces does not automatically indicate a tracking failure.
GA4 reports, Explorations, APIs, BigQuery exports, and downstream BI dashboards can represent different stages of the measurement system. They may differ because of processing time, reporting logic, attribution, sampling, privacy protections, cardinality, query definitions, or transformations performed after export.
The useful question is therefore not: “Which tool has the correct number?”
It is: “Are these numbers measuring the same thing, from the same data state, using the same rules?”
That distinction turns an analytics discrepancy from a debugging argument into a reconciliation problem.
Start With the Measurement Pipeline
A simplified digital analytics pipeline looks like this:
- User behavior
- Tracking
- GA4 collection
- GA4 processing
- Reporting surface
- Export
- Transformation
- BI dashboard
A discrepancy can enter at almost every transition. For example, the browser sends an event, GA4 receives it, GA4 processes it for reporting, BigQuery receives exported event-level data, SQL transforms those events, and a BI tool aggregates the transformed table.
If the dashboard and GA4 disagree, comparing only the final two numbers skips most of the system. A better reconciliation process works backward through the pipeline.
First Ask: Are You Comparing the Same Metric?
Consider this statement: “GA4 says 8,200 users, but our warehouse says 8,640.” Before investigating tracking, define user.
Possible definitions include:
- distinct
user_pseudo_id; - distinct authenticated
user_id; - GA4 Active Users;
- Total Users;
- users after an internal-traffic exclusion;
- users after identity stitching;
- users in a modeled reporting surface.
Those are not interchangeable definitions. The same issue occurs with sessions, conversions, revenue, engaged sessions, and acquisition metrics.
A reconciliation should therefore begin with a metric contract.
| Field | Example |
|---|---|
| Metric | Purchase revenue |
| Date basis | Event date |
| Time zone | America/Chicago |
| Included events | purchase |
| Revenue field | Ecommerce purchase revenue |
| Currency treatment | USD only |
| Internal traffic | Excluded |
| Refund treatment | Subtracted separately |
| Attribution | Not used for total revenue |
| Finalization window | Previous day after stable processing |
Without this definition, two analysts can write technically valid queries that answer different questions.
Data Freshness Can Change Yesterday’s Number
Analytics data is not always final immediately after collection. Google documents multiple processing intervals for GA4, including realtime, intraday, and daily processing. Google also notes that processing can take 24–48 hours, during which report values may change.
That matters when a business runs a dashboard at 7:00 AM and compares it with a report viewed later in the afternoon.
| Check time | Purchases |
|---|---|
| 7:00 AM | 482 |
| 12:00 PM | 497 |
| Next day | 501 |
The 7:00 AM value was not necessarily erroneous. It may have been incomplete.
This creates an important governance question: Does the business need the fastest available number or the most stable number? Those are different requirements. A real-time operations dashboard may accept incomplete data; a monthly finance reconciliation generally should not.
Intraday Data Is Not the Same as Final Daily Data
This distinction becomes especially important with BigQuery. GA4 streaming export creates an events_intraday_YYYYMMDD table that is populated throughout the day. Google describes streaming export as best effort and notes that it may not contain all data because of factors such as late events or failed uploads. When the complete daily table is ready, the intraday table is removed.
Google specifically recommends querying the completed events_YYYYMMDD table rather than the intraday table when a stable daily dataset is required.
This suggests a simple architectural rule:
- Intraday table → operational monitoring
- Daily table → stable reporting and reconciliation
That does not mean every organization must follow exactly this architecture. It means the data contract should specify which state of the data a report uses.
Worked Example: A Dashboard That Changes Overnight
Suppose a business dashboard calculates yesterday’s purchases from an intraday table.
| State | Purchases |
|---|---|
| 11:30 PM intraday | 1,184 |
| Following afternoon finalized daily table | 1,213 |
| Difference | 29 purchases |
Percentage difference relative to the finalized value: 29 / 1,213 = 2.39%. If average order value is $92, then 29 × $92 = $2,668.
A dashboard based on the earlier snapshot could therefore understate observed purchase revenue by approximately $2,668 in this simplified example.
That does not prove that every 2.39% discrepancy is caused by processing delay. It demonstrates why reconciliation must distinguish provisional data from finalized data before investigating other causes.
GA4 Reports and BigQuery Are Different Analytical Surfaces
Another common assumption is: “BigQuery contains GA4 data, so a SQL query should reproduce every GA4 report exactly.” That is too strong.
Google’s comparison of Analytics reporting surfaces notes that BigQuery provides event- and user-level data but excludes certain value additions GA4 makes in standard reports and Explorations. The same comparison shows that reporting surfaces can differ in areas such as high-cardinality handling, sampling, and data-driven attribution.
Google’s BigQuery documentation similarly describes the export as raw, unsampled event data and notes that BigQuery contains the raw event data Analytics receives rather than all product-linked additions.
Therefore: BigQuery is not simply a downloadable copy of every number visible in the GA4 interface. It is an analytical data source from which organizations can define their own metrics. That flexibility is powerful—but it also transfers more responsibility to the analyst.
Sampling Can Create Another Difference
GA4 Explorations allow analysts to perform more detailed ad hoc analysis. However, Google states that Explorations can use sampled data when a query involves more than 10 million events.
Suppose the underlying population contains 40 million events. An Exploration processes a representative sample and estimates a result. A BigQuery query evaluates the exported event records directly. The two outputs may be very close, but they do not have to be identical.
The correct response is not to assume one system failed. First check whether the Exploration indicates sampling.
Privacy Thresholding Can Suppress Some Results
GA4 also applies data thresholds in certain reporting situations to protect users from identification. Google notes that Reports and Explorations can be subject to thresholds, particularly when demographic information or Google signals data is involved.
Imagine a report segmented by City × Age × Gender × Campaign. Some combinations may represent very small populations. A reporting surface may suppress information for privacy reasons. A downstream dataset built from different fields or logic may therefore not reproduce the same visible rows.
This is another reason reconciliation should document not only the metric but also the dimensions used in the comparison.
High Cardinality Can Hide Detail Inside “(other)”
Suppose an ecommerce site has tens of thousands of distinct page paths, campaign parameters, or product combinations. GA4 reporting tables have row limits. Google explains that when the number of dimension values exceeds a table’s row limit, less common values can be grouped into an “(other)” row.
| Source | Revenue |
|---|---|
| $400,000 | |
| $150,000 | |
| $45,000 | |
| 8,000 small sources | $120,000 |
A highly detailed report may aggregate some lower-frequency values. A BigQuery query can still analyze the exported records individually. If an analyst compares visible rows without accounting for (other), the totals or detail may appear inconsistent.
Attribution Creates a Different Kind of Discrepancy
Suppose a customer clicks a paid social ad, returns later through organic search, and purchases for $300. Which channel receives the revenue? That depends on the attribution question and rules being applied.
Google notes that some reporting surfaces support data-driven attribution while raw BigQuery export does not simply reproduce that reporting-layer attribution treatment.
This means an analyst should distinguish:
- Event occurrence
- Attribution credit
The purchase itself can be observed. The decision about which marketing touchpoint receives credit is a measurement model. And neither attribution assignment proves causality.
If a report attributes $300 to a channel, that does not establish that the channel caused $300 of incremental revenue. Causal incrementality asks a different question: What would have happened without the marketing exposure? The distinction is also important in the existing marketing attribution and incrementality analysis.
Your SQL Can Also Be the Problem
Not every discrepancy is caused by GA4. Sometimes the warehouse query is wrong. A classic example is join duplication.
| order_id | revenue |
|---|---|
| A | $100 |
| B | $200 |
True revenue: $300.
| order_id | touch |
|---|---|
| A | Paid Search |
| A | |
| B | Organic |
A naïve join produces:
| order_id | revenue | touch |
|---|---|---|
| A | $100 | Paid Search |
| A | $100 | |
| B | $200 | Organic |
Summed revenue becomes $400, overstating revenue by ($400 − $300) / $300 = 33.3%.
The tracking can be perfect. GA4 can be working correctly. The error exists in the analytical transformation.
This is why reconciliation must include row-grain validation before aggregation. The site’s existing data-quality checks for analytics pipelines provide a related foundation for that validation work.
A Practical GA4 Reconciliation Framework
When two numbers disagree, investigate in this order.
- Definition
- Scope
- Freshness
- Reporting
- Transformation
- Presentation
1. Definition
Are both systems measuring the same metric? Check the metric definition, event name, user definition, session definition, conversion/key-event definition, and revenue field.
2. Scope
Are the filters identical? Check date range, time zone, hostname, country, device, channel, internal traffic, and consent conditions.
3. Data State
Are both datasets equally mature? Check realtime, intraday, daily, late-arriving data, and refresh timestamp.
4. Reporting Behavior
Could GA4’s reporting layer alter the visible result? Check sampling, privacy thresholds, “(other)” rows, reporting identity, and attribution.
5. Transformation
Could downstream logic change the number? Check joins, deduplication, filters, sessionization, calculated fields, currency conversion, and refund treatment.
6. Presentation
Could the BI layer introduce another difference? Check dashboard filters, calculated measures, date logic, cached extracts, and aggregation level.
Use Reconciliation Queries, Not Guesswork
A useful warehouse validation begins at the simplest possible grain.
SELECT
  event_date,
  COUNT(*) AS purchase_events
FROM `project.analytics_property.events_*`
WHERE event_name = 'purchase'
GROUP BY event_date
ORDER BY event_date;
The code is illustrative. It does not imply that the placeholder project or dataset exists.
Then progressively add business logic. The principle is: Validate the base event count before validating the complex dashboard metric.
If the raw event count already disagrees with the expected collection behavior, investigate earlier in the pipeline. If the raw count is correct but the dashboard is wrong, move downstream. This is much faster than debugging the entire system at once.
Create a Reconciliation Table
For important KPIs, maintain a lightweight validation table.
| Metric | GA4 | BigQuery | Dashboard | Difference | Status |
|---|---|---|---|---|---|
| Purchases | 1,213 | 1,211 | 1,211 | -0.16% | Review |
| Revenue | $111,540 | $111,420 | $111,420 | -0.11% | Review |
| Users | 38,210 | 39,004 | 39,004 | +2.08% | Expected definition difference |
The purpose is not to force every column to equal zero. Instead, classify differences as:
- Expected — a known consequence of metric or reporting design;
- Temporary — likely related to processing or incomplete data;
- Unexpected — requires investigation.
That classification is much more useful than labeling every mismatch an error.
Define Tolerances Before the Dashboard Breaks
Suppose an organization expects finalized purchase counts between GA4 and its validated warehouse transformation to remain within 0.5%.
These thresholds are illustrative, not universal GA4 standards. A tolerance should reflect metric importance, known processing behavior, transaction volume, reporting use, and historical variance. Finance-critical revenue may require a different tolerance from exploratory engagement metrics.
Reconciliation Is a Governance Process
The strongest analytics systems do not depend on analysts remembering why two numbers differ. They document it.
For each important metric, record the business definition, technical definition, source, owner, refresh cadence, finalized-data rule, expected differences, reconciliation tolerance, and known reporting limitations.
Then a stakeholder asking, “Why does this dashboard show 12,731 when GA4 shows 12,480?” does not trigger a two-day investigation every time. The organization already knows how to evaluate the difference.
The Goal Is Not Perfect Agreement
There is a tempting objective in analytics: Make every tool display exactly the same number.
Sometimes that is appropriate. For example, two dashboards claiming to display the same governed revenue KPI should normally reconcile.
But forcing fundamentally different analytical surfaces to match can also create false confidence. GA4 reports may answer one question. BigQuery may support another. A financial system may remain the source of truth for recognized revenue. A CRM may define qualified leads.
The goal is therefore not universal numerical equality. The goal is: consistent definitions, understood differences, reproducible transformations, and numbers that are appropriate for the decision being made.
When those conditions are met, a discrepancy becomes explainable. And explainable analytics is far more valuable than a collection of dashboards that merely happen to show the same number.
For the broader operational context, the existing dashboard reconciliation article examines how data definitions, joins, pipelines, validation, and business rules shape the numbers organizations rely on. Related measurement implementation work is part of marketing and digital analytics consulting, while warehouse-side validation connects naturally to data engineering and database analytics.
References / Further Reading
Are Your Analytics Systems Telling Different Stories?
UAD Consulting helps organizations structure measurement systems, validate analytics pipelines, reconcile reporting differences, and build dashboards around governed business definitions.
Explore ServicesGet in Touch