Imagine receiving a dataset with ten million rows and hundreds of variables. You have more data than you could reasonably inspect manually. You can calculate correlations, segment customers, train predictive models, and build dashboards containing dozens of metrics.
You may discover hundreds or even thousands of statistical relationships. But there is still a fundamental question: What are you actually looking for?
More data does not automatically produce more understanding. Before an analyst can decide which relationships matter, which variables deserve attention, or which patterns should influence a business decision, there usually needs to be some structure behind the investigation.
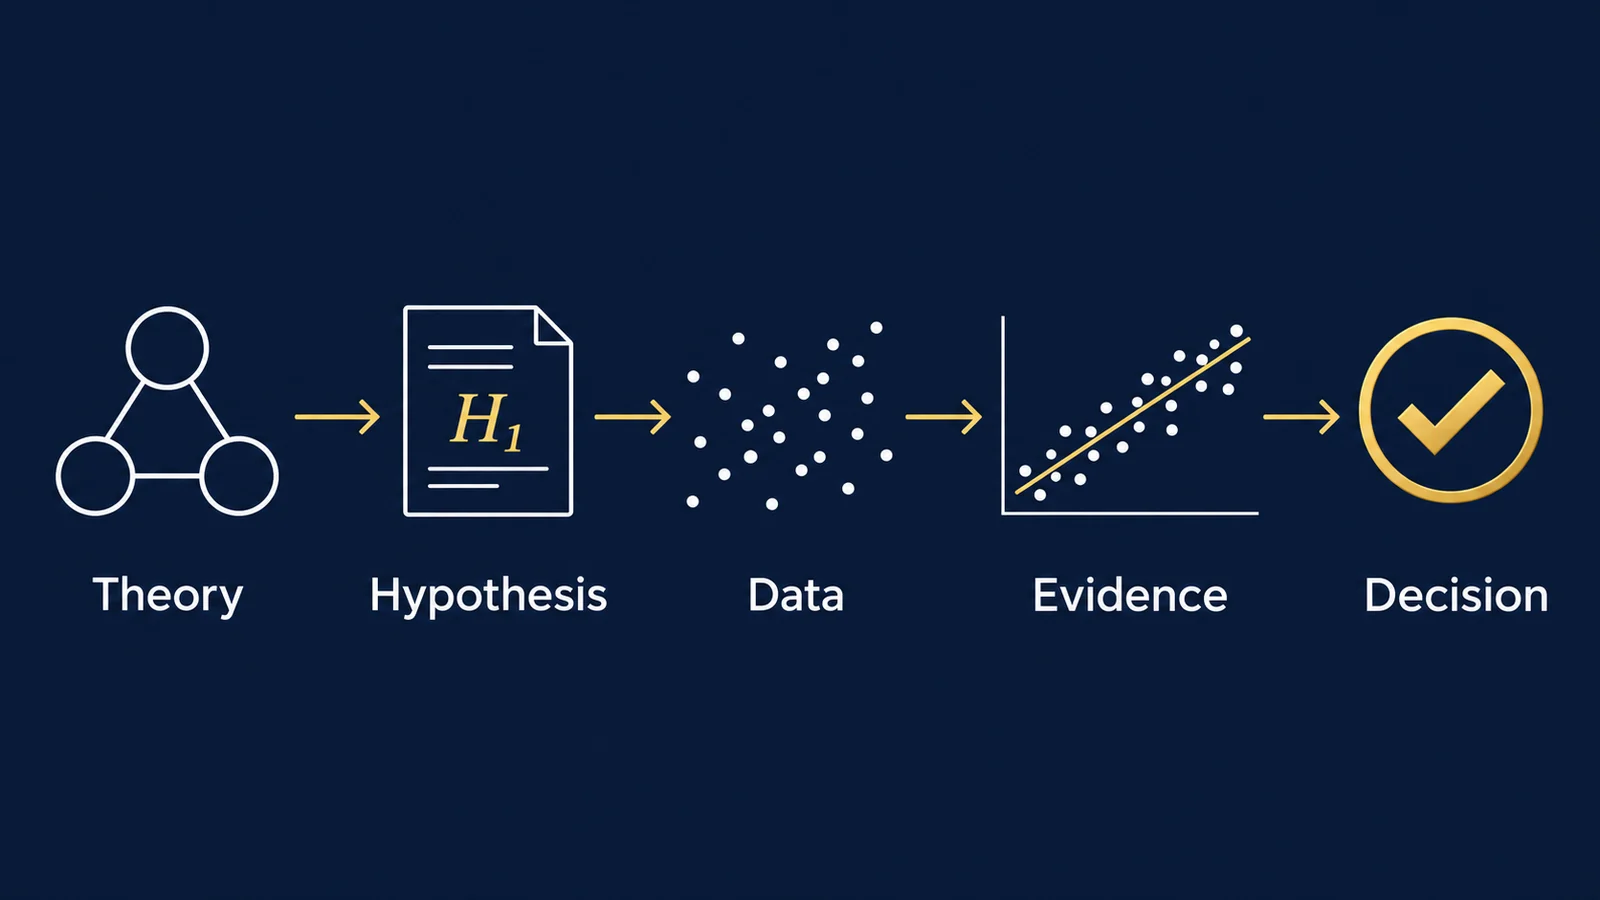
That structure often begins with theory. Theory helps us describe how we believe a system works. From theory, we can formulate research questions; from those questions, we can develop hypotheses. Data then gives us evidence with which to evaluate those hypotheses.
The analytical process therefore should not always begin with “Let's look at the data and see what we find.” A stronger sequence is often:
Theory → Research Question → Hypothesis → Data → Test → Evidence → Decision
This distinction matters because data can reveal patterns. But patterns do not interpret themselves.
Data Is Observation, Not Explanation
Suppose a company analyzes customer behavior and discovers that customers who contact customer support more frequently also have higher churn rates. The observation may be statistically correct. But what does it mean?
One interpretation could be: poor product experience leads to more support contacts, dissatisfaction, and then churn. That is a plausible mechanism. But another explanation is possible: customers already considering leaving may contact support more often before they churn.
Or a third variable could affect both. Product complexity, for example, might lead to more support contacts and independently be associated with higher churn. The dataset may show the association. It does not automatically tell us which explanation generated it.
This is where analytical reasoning becomes more important than simply calculating another metric. The analyst needs a conceptual model of what might be happening, which can generate hypotheses for further investigation.
Theory Gives Observations Structure
The word “theory” can sound unnecessarily academic in a business setting. But the basic idea is practical: a theory is an explanation of how or why variables may relate to one another.
- A marketing team might believe that greater advertising exposure increases brand awareness, which increases purchase probability.
- An operations team might believe that longer processing times increase abandonment.
- A healthcare analyst might propose that delayed access to appropriate treatment increases the probability of an adverse outcome.
- A product team might believe that a difficult onboarding process reduces early engagement, which increases subsequent churn.
Each statement proposes a mechanism. That mechanism tells the analyst what variables may matter and what relationships should be investigated.
Without such a framework, analysis can become an open-ended search through every available variable. With enough data and enough comparisons, interesting patterns will almost always appear. Not all of them are meaningful.
Ptolemy and the Importance of the Model Behind the Data
The history of astronomy offers a useful illustration. Ancient astronomers observed real patterns in the sky. Planetary positions changed over time, and some planets appeared from Earth's perspective to reverse direction temporarily—a phenomenon now called apparent retrograde motion.
Claudius Ptolemy developed a sophisticated geocentric framework that represented planetary motions through combinations of circular motions. The point is not that Ptolemy lacked observations or that historical science followed a simple progression from “wrong” to “right.” His mathematical system organized observations and supported useful predictions for centuries.
Later developments reorganized the theoretical and mathematical picture. Copernicus proposed a heliocentric arrangement but retained circular planetary orbits. Kepler used careful observations to describe elliptical orbits, and Newton later supplied a physical theory that explained planetary motion in a broader way. These changes were cumulative and historically complex, not a one-step correction by a single person.
The analytical lesson is that observations are interpreted within a model of the system. A dataset can contain accurate observations while an explanation of those observations remains incomplete. Data constrains our explanations. It does not automatically generate the correct explanation for us. For historical context, see OpenStax's account of ancient astronomy and NASA's overview of orbits and Kepler's laws.
A Better Way to Think About Analytics
Each stage in a disciplined analytical sequence serves a different purpose:
- Theory: What do we believe about how the system works?
- Research question: What specifically do we want to understand?
- Hypothesis: What observable relationship should exist if our explanation is useful?
- Data: What evidence can help evaluate that expectation?
- Test: Does the observed evidence behave as predicted?
- Evidence: How strongly does the result support, contradict, or complicate the hypothesis?
- Decision: Does the evidence justify changing an action, policy, investment, or strategy?
This structure turns analysis from an unrestricted search for interesting numbers into a disciplined investigation. It is a practical guide, not a requirement that every business question begin with a formal academic theory.
What Is a Hypothesis?
A hypothesis translates an idea into something that can be evaluated using evidence. Suppose an e-commerce company believes that slow checkout performance causes customers to abandon purchases.
The broad theory might be that greater friction during checkout reduces conversion. A research question could be: does slower checkout performance correspond to lower checkout completion? A testable hypothesis might be that sessions with checkout load times above a defined threshold will have lower completion rates than otherwise comparable sessions with faster load times.
Now the analysis has direction. The analyst knows what outcome and exposure matter, can consider potential confounders, and can decide whether observational analysis is sufficient or an experiment would provide stronger evidence. The hypothesis has transformed a vague exercise into a specific question.
Hypotheses Reduce the Search Space
Modern datasets create an unusual problem: analysts often have too many possible questions rather than too little data. With 100 variables there are thousands of possible pairwise relationships. Add transformations, segments, time periods, interactions, lagged variables, geographies, and alternative outcomes, and the search space becomes enormous.
If analysts repeatedly search this space for statistically interesting results, some patterns can appear by chance. Theory and pre-specified hypotheses help reduce that search space. Instead of asking “Which variables correlate with churn?” an analyst might ask “Does onboarding completion predict 90-day retention after accounting for customer tenure and acquisition channel?” The narrower question is easier to interpret.
But Theory Should Not Become a Prison
If analysts become too committed to a theory, they may look only for evidence that confirms it. That is not the purpose of theory. A good hypothesis must create the possibility of being wrong.
Suppose management believes that increasing promotional email frequency increases revenue. The analysis should also allow for evidence that contradicts this expectation. Perhaps more frequent email initially coincides with higher conversions but also with more unsubscribes or weaker long-term customer value.
The proper process is not “theory → find supporting data → confirm theory.” It is “theory → generate a testable expectation → examine evidence → update belief.” If evidence contradicts the original expectation, the explanation should be revised. Willingness to update is essential.
Data Exploration Still Matters
None of this means analysts should avoid exploring data without a formal hypothesis. Exploratory data analysis is valuable. It can reveal unexpected distributions, missing data, unusual segments, anomalies, nonlinear relationships, operational problems, measurement errors, and patterns worth investigating.
The useful distinction is between exploration and confirmation. Exploration can generate hypotheses; confirmatory analysis evaluates hypotheses. If an analyst unexpectedly discovers unusually high churn among mobile users from one channel, that may generate a new hypothesis about the landing-page or product experience. Additional evidence can then examine the explanation.
A productive cycle is: explore → observe a pattern → develop an explanation → formulate a hypothesis → test → update. Exploration and theory are not competitors; they can reinforce one another. NIST describes exploratory data analysis as a way to uncover structure, identify important variables, detect anomalies, test assumptions, and develop parsimonious models. See the NIST overview of exploratory data analysis.
The Danger of Finding a Story After Seeing the Result
One easy analytical mistake is to examine a result first and construct an explanation afterward. Suppose customers who use Feature A have 25% higher retention. It is tempting to say that Feature A increases engagement and engagement improves retention.
But highly engaged customers may simply be more likely to discover Feature A. In that case, engagement could lead both to Feature A usage and to retention. The feature may be a marker of engagement rather than its cause.
This distinction matters for business decisions. If management invests in forcing every customer to use Feature A, the expected retention improvement may never appear. A compelling story is not the same as a validated mechanism. The observed association needs a design capable of addressing alternative explanations before it supports a causal claim.
Statistical Significance Does Not Create Meaning
Suppose a company has five million customer sessions. Users with one behavior have a conversion rate of 4.01%, while another group has a rate of 4.00%. With a sufficiently large sample, very small differences can sometimes be statistically detectable.
But does the difference matter? Statistical significance does not automatically establish practical significance, causal importance, strategic relevance, economic value, or decision usefulness. A statistically detectable effect with almost no economic impact may deserve little management attention. A less certain effect involving a major operational risk may deserve more.
Statistical reasoning can help quantify uncertainty and compare evidence, but decision context determines relevance. NIST's guidance on statistical comparisons and hypothesis testing is one reference for interpreting evidence within a defined question.
Prediction Is Not the Same as Explanation
Machine learning makes this distinction especially important. A predictive model may accurately estimate which customers are likely to churn using usage frequency, support interactions, tenure, payment behavior, device type, and other variables.
If the model predicts churn accurately, that is valuable. But prediction answers “Who is likely to churn?” Management may instead need to know “What can we change to reduce churn?” Those are different questions.
A variable can be highly predictive without being a useful intervention target. Tenure may predict churn, but a company cannot directly assign a customer six additional months of tenure. Support contacts may predict churn without reducing contacts being an appropriate intervention. Prediction identifies patterns useful for forecasting; theory and causal reasoning help identify mechanisms and potential interventions.
Dashboards Also Depend on Theory
Even a dashboard contains implicit theories. Why does an executive dashboard display revenue, conversion rate, customer acquisition cost, retention, and average order value instead of dozens of other measures? The selection reflects an implicit model of how the business creates value.
For example, traffic and conversion combine to produce customers; customers and average order value contribute to revenue; revenue less acquisition and operating costs contributes to economic value. A dashboard is not simply “showing the data.” Someone has decided which measurements represent the business. A good KPI framework makes that logic explicit.
For a practical example of selecting measures from a decision, see which KPIs belong on a dashboard.
More Data Does Not Automatically Solve a Bad Question
Suppose a company asks which customers saw advertising before purchasing. It may collect billions of impression records. But if its actual decision is “How much incremental revenue did advertising cause?” more impression records do not automatically answer the causal question.
The analyst must distinguish exposure from incrementality. A larger dataset can estimate the wrong quantity with extraordinary precision. More data reduces some forms of uncertainty; it does not repair a poorly defined question. Before collecting more data, ask whether the analytical framework can answer the decision question.
A Useful Hypothesis Has Business Consequences
A hypothesis is especially valuable when different possible results imply different actions. Consider: “Long customer-support response times increase churn among new customers.” If supported by suitable evidence, possible actions could include prioritizing new customers, changing support routing, or setting response-time targets. If unsupported, management may avoid an investment that would not address the main problem.
This creates a useful test: If the result would not change any decision, why are we running the analysis? Some analysis builds knowledge without an immediate action, but decision relevance should usually be understood before substantial analytical resources are committed.
From Business Question to Testable Hypothesis
“Why are sales falling?” is too broad for a single analysis. Decompose it into possible mechanisms: website traffic may have declined; traffic may be stable while conversion fell; customer volume may be stable while average order value declined; channel performance may differ; or existing customers may be purchasing less often.
Each explanation implies different data requirements and actions. Problem framing often creates more value than immediately opening a dashboard. The first analytical task is often not calculation; it is decomposition.
Theory Can Come From Multiple Sources
Business theories need not come only from academic journals. Useful reasoning can come from prior research, economic principles, operational knowledge, customer interviews, domain experts, experiments, process maps, historical experience, and observed behavior.
The source matters less than whether the proposed mechanism is coherent and testable. A warehouse manager may know that congestion near one processing station creates downstream delays. That knowledge can generate a hypothesis, and data can evaluate whether delays increase when congestion reaches the proposed threshold.
Domain expertise and analytics are complements: analysts contribute measurement and testing; domain experts contribute knowledge of how the system operates. Strong analysis often combines both.
Hypothesis-Driven Does Not Mean Hypothesis-Only
If analysts test only hypotheses leadership already believes, genuinely new discoveries may be missed. A mature workflow leaves room for both confirmatory and exploratory analysis. The key is to label them appropriately.
An unexpected pattern discovered during exploration should not be presented as though it had been predicted in advance. Identify it, propose explanations, formulate a hypothesis, obtain additional evidence, and test whether the relationship persists. This reduces the risk of turning random patterns into confident business narratives.
The Model Determines What the Data Means
Every analytical model contains assumptions. A regression model assumes a mathematical structure. A forecast assumes historical patterns contain information about the future. A segmentation assumes selected variables capture meaningful customer differences. A KPI framework assumes selected measurements represent performance. A simulation assumes its probability distributions reasonably describe uncertainty.
Even descriptive analysis requires choices about definitions, time windows, aggregation, exclusions, denominators, and comparison groups. There is no completely assumption-free analysis. The goal is not to eliminate assumptions, but to make important assumptions visible and testable.
Theory Helps Determine What Data to Collect
Theory is useful before data collection as well. A company investigating subscription cancellations may already have dates, payments, plan types, logins, and cancellation records. But a plausible explanation may also involve perceived value, product difficulty, unresolved support issues, competitor offers, or changes in customer needs.
Those variables may not exist in the current dataset. A conceptual framework exposes the measurement gap and can motivate collecting survey responses, support-resolution data, product telemetry, experiment data, or structured cancellation reasons. Without a framework, analysts may repeatedly study what happens to be available rather than what is needed.
A Practical Framework for Business Analytics
Before beginning a major analysis, ask:
- What decision are we trying to support? Define the action or choice.
- What do we currently believe about the system? State the mechanism or conceptual model.
- What would we expect to observe if that explanation were useful? Translate the theory into a testable hypothesis.
- What evidence would contradict our expectation? Make the hypothesis capable of being challenged.
- What data is required? Identify variables, populations, time periods, and measurement needs.
- What alternative explanations exist? Consider confounding, reverse causality, selection effects, measurement error, and coincidence.
- What decision would change based on the result? Connect evidence back to action.
This process can prevent sophisticated analysis from being applied to poorly framed problems. If the uncertainty itself is central to a choice, a next step may be to compare scenario analysis and Monte Carlo simulation—while choosing model complexity according to the decision and available evidence.
From Data Analytics to Decision Analytics
Data analytics often begins with measurement: what happened, how much, where, when, and to whom? Those questions are essential. But business decisions eventually require deeper questions: why might this be happening, what could happen if we changed something, how uncertain is our conclusion, what evidence would change our belief, and what action should follow?
The progression can be represented as data → information → evidence → explanation → decision. The transition from information to explanation is where theory becomes especially important. Without it, organizations risk accumulating dashboards without accumulating understanding.
The Goal Is Not to Prove the Theory
The purpose of analytics is not to prove that our original idea was correct. Sometimes the most valuable result is: the data did not behave as expected.
That may reveal an incorrect assumption, a missing variable, a measurement problem, unexpected customer behavior, a changing market, or an incomplete theory. That is analytical progress. A useful analytical culture rewards learning, not just confirmation. The analyst's job is not to defend a hypothesis, but to subject it to evidence.
Data Needs a Question
Modern organizations rarely suffer from a complete absence of data. They are more likely to struggle with too many metrics, disconnected dashboards, unclear definitions, unexplained correlations, and analyses that never affect decisions.
The solution is not always another dataset. Sometimes the missing element is a better question. Theory gives the question structure. Hypotheses make the theory testable. Data provides evidence. Analysis evaluates that evidence, and decision-making determines what happens next.
The strongest workflow is not “collect data → find a pattern → tell a story.” It is:
Define the Decision → Develop a Theory → Form a Hypothesis → Identify Evidence → Test Expectations → Consider Alternatives → Update the Explanation → Make the Decision
Data is indispensable. But data does not speak for itself. We give observations meaning by asking disciplined questions about what they represent, why they may be related, and what evidence would cause us to change our minds. That is the difference between finding patterns and building understanding.
References / Further Reading
Turn Data Into Better Decisions
UAD Consulting helps businesses move beyond disconnected metrics by structuring analytical questions, testing evidence, and translating data into practical decisions.
Explore ServicesGet in Touch