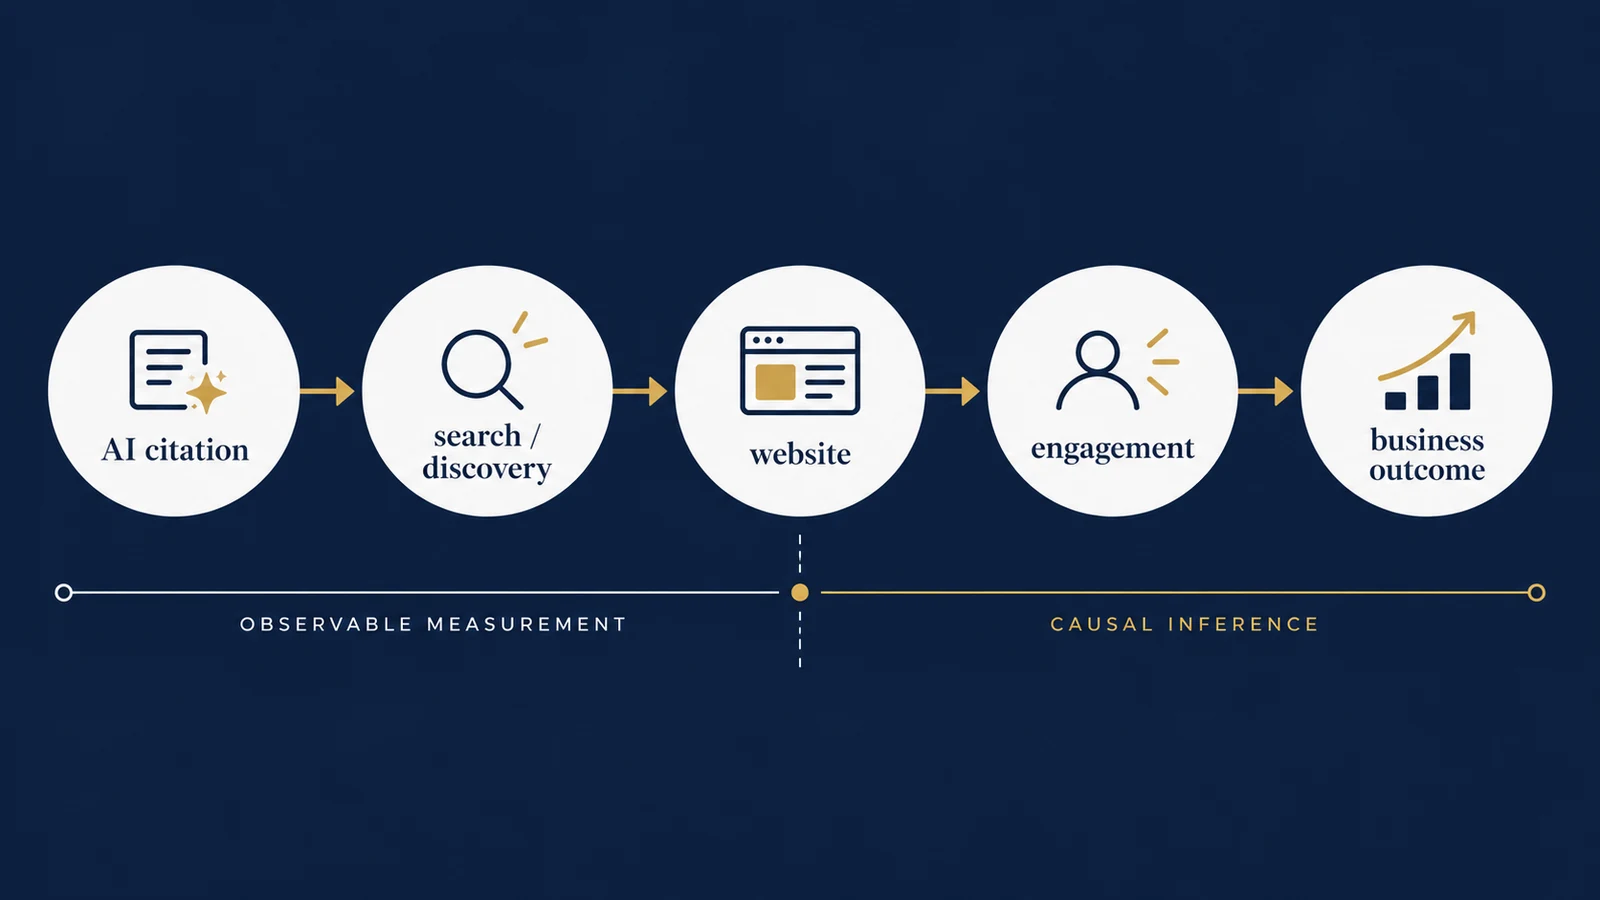
Being cited by an AI answer system is useful evidence of visibility.
It is not evidence that the citation generated revenue.
That distinction is becoming increasingly important as businesses begin monitoring whether their websites appear as sources in AI-generated answers.
The measurement problem is straightforward:
- AI citation
- Search / discovery
- Website
- Engagement
- Business outcome
But each arrow represents a different analytical question.
A company might increase its AI citations without receiving more website visits.
It might receive more visits without generating more qualified inquiries.
And qualified inquiries might increase at the same time as AI visibility without AI search necessarily causing the increase.
A useful measurement framework therefore should not collapse AI visibility into one number.
Instead, it should connect several layers of evidence.
Start by Separating Visibility From Traffic
Traditional search analytics already teaches an important lesson: an impression is not a click.
Google Search Console distinguishes metrics such as impressions, clicks, queries, and average position. An impression indicates that a result was shown; a click represents a different user action.
AI citations require a similar distinction.
A citation tells us that a page was used or displayed as a source within the measured AI environment.
That does not automatically mean:
- the user noticed the citation;
- the user clicked it;
- the visitor engaged with the website;
- the visitor became a lead;
- the lead became a customer.
Each stage should be measured separately.
What Can We Actually Measure?
AI-search measurement is becoming more observable.
In February 2026, Bing Webmaster Tools introduced AI Performance reporting for supported Microsoft AI experiences. The report includes measures such as total citations, average cited pages, grounding queries, page-level citation activity, and citation trends over time.
Microsoft expanded those capabilities in June 2026 with additional views including Topics, Intents, Citation Share, and period comparisons. Citation Share represents the percentage of citations attributed to a site among citations shown across sites for a particular grounding query. Microsoft explicitly describes it as an observational measure rather than a ranking or traffic-share metric.
This creates an important opportunity.
Instead of asking only:
“Are AI systems citing us?”
a business can ask:
“Which topics generate citations, which pages receive them, and what happens elsewhere in our measurement system as that visibility changes?”
The AI Visibility-to-Outcome Funnel
A useful framework has five layers:
- Citation
- Discovery
- Visit
- Engagement
- Outcome
1. Citation
Was the company's content referenced in an AI-generated answer?
Possible measures include:
- total citations;
- cited pages;
- citation coverage across a controlled prompt set;
- citation share where first-party reporting provides it;
- citation trend over time.
2. Discovery
Is the underlying topic gaining visibility?
Supporting evidence may include:
- Search Console impressions;
- query visibility;
- landing-page impressions;
- non-branded search growth;
- visibility across related topic clusters.
3. Visit
Did people actually reach the website?
Measures might include:
- sessions;
- users;
- landing-page sessions;
- referral traffic where identifiable;
- source/medium dimensions.
Google Analytics, for example, records traffic-source dimensions such as session source that can help identify where measurable sessions originated.
Not every AI-driven visit will necessarily be cleanly identifiable as a dedicated “AI” channel, so traffic measurement should not assume perfect classification.
4. Engagement
Once users arrive, do they interact with useful content?
Examples include:
- reading another article;
- viewing a service page;
- opening a case study;
- clicking a report;
- reaching the Contact page;
- starting a consultation flow.
5. Outcome
Did the interaction produce something commercially meaningful?
Examples include:
- qualified inquiry;
- discovery call;
- proposal request;
- sales opportunity;
- client;
- attributable revenue where evidence permits.
These five layers should not be treated as interchangeable.
A Worked Example
Suppose a consulting firm monitors 50 stable prompts related to its areas of expertise.
During Month 1:
- cited in 4 prompts;
- 20,000 relevant organic impressions;
- 900 organic sessions to the monitored content cluster;
- 90 service/case-study visits from those landing sessions;
- 6 qualified inquiries.
During Month 3:
- cited in 10 prompts;
- 31,000 relevant organic impressions;
- 1,300 organic sessions;
- 156 service/case-study visits;
- 9 qualified inquiries.
| Metric | Month 1 | Month 3 | Change |
|---|---|---|---|
| Prompt citation coverage | 8% | 20% | +12 pp |
| Relevant search impressions | 20,000 | 31,000 | +55% |
| Organic content sessions | 900 | 1,300 | +44% |
| Service/case-study visits | 90 | 156 | +73% |
| Qualified inquiries | 6 | 9 | +50% |
The tempting conclusion is:
“Increasing AI citations generated 50% more leads.”
The data does not establish that.
What it establishes is that citation visibility, search visibility, engagement, and qualified inquiries all increased during the observation period.
That is useful evidence.
It is not yet causal evidence.
Attribution Is Not Causality
Suppose a visitor clicks a link from an AI platform and submits a consultation request.
Analytics may allow the business to attribute that session or conversion to the referring source.
That answers:
“Which observable source received credit for this conversion under our attribution rules?”
It does not necessarily answer:
“Would this customer have converted if the AI citation had never existed?”
The second question is causal.
A customer might have:
- discovered the company through an AI answer;
- returned later through Google;
- read two articles;
- visited LinkedIn;
- returned directly;
- submitted the contact form.
Last-touch attribution might credit Direct.
First-touch attribution might credit the AI referral.
Neither alone proves the incremental effect of AI visibility.
This is why measurement reports should distinguish observed attribution from causal impact.
For a related treatment of this distinction, see Marketing Attribution vs. Incrementality.
Citation Coverage and Citation Share Are Different
These two metrics sound similar but answer different questions.
A custom citation coverage measure can be calculated from a controlled prompt set:
| Citation Coverage | Prompts With At Least One Citation / Prompts Tested |
|---|
If a company tests 50 prompts and appears as a cited source for 10:
10 / 50 × 100 = 20% citation coverage
The correct interpretation is:
“The site was cited in 20% of this monitored prompt set.”
It is not:
“The company has 20% of AI search.”
Bing's Citation Share is a different first-party metric. Microsoft defines it relative to citations shown across sites for a particular grounding query.
The names should therefore not be used interchangeably.
Measure Topics, Not Only Individual Pages
Suppose a consulting website publishes five articles about data quality:
- dashboard reconciliation;
- duplicate joins;
- pipeline validation;
- metric definitions;
- data-quality monitoring.
A potential client may interact with the entire topic cluster rather than one article.
That suggests a useful unit of analysis:
Topic Cluster → Visibility → Landing Pages → Commercial Exploration → Outcome
| Topic cluster | AI citations | Organic sessions | Service visits | Qualified inquiries |
|---|---|---|---|---|
| Data Quality | 24 | 1,800 | 210 | 8 |
| Marketing Analytics | 17 | 1,250 | 175 | 7 |
| Health Economics | 8 | 620 | 92 | 5 |
| AI Search | 31 | 2,400 | 260 | 4 |
The AI Search cluster has the highest citations and traffic.
But Health Economics produces more qualified inquiries relative to traffic.
That creates a more useful business question:
“Which topics create visibility, and which topics attract commercially relevant audiences?”
Build a Measurement Matrix
A practical AI-search measurement system can use four evidence classes.
| Layer | Example metric | Source | What it tells us |
|---|---|---|---|
| AI visibility | Citations / citation share | AI visibility reporting | Content is being surfaced as evidence |
| Search visibility | Impressions / queries | Search Console | Search demand and discoverability |
| Website behavior | Sessions / CTA events | Analytics | Visitors interacted with the site |
| Business outcome | Qualified leads / opportunities | CRM or lead records | Commercial activity occurred |
The strength comes from combining the layers.
No individual metric needs to carry more meaning than it actually supports.
Do Not Turn Everything Into One AI Score Too Early
It can be tempting to combine citation counts, impressions, sessions, engagement, and leads into a single score such as:
AI Visibility Score = 72/100
Composite scores can be useful for internal monitoring.
But they introduce an important problem:
Who decided the weights?
Suppose:
- citations receive 30%;
- impressions receive 20%;
- engagement receives 20%;
- leads receive 30%.
A different weighting system could produce a materially different score from exactly the same underlying data.
Therefore, if a composite score is used, the organization should document:
- the components;
- normalization method;
- weights;
- baseline;
- interpretation;
- limitations.
For many businesses, a transparent scorecard is more useful than a single synthetic KPI. The same principle applies to a KPI framework: definitions and decision use matter more than the appearance of precision.
A Better Executive Dashboard
Instead of one AI visibility score, consider a compact dashboard:
Visibility
- Citation coverage: 20%
- Cited pages: 14
- Relevant search impressions: 31,000
Engagement
- Organic content sessions: 1,300
- Service/case-study exploration rate: 12%
Commercial Outcomes
- Qualified inquiries: 9
- Discovery calls: 5
- Opportunities: 2
Trend: Citation coverage ↑ Search visibility ↑ Engagement ↑ Qualified inquiries ↑
The dashboard allows management to see where evidence is strengthening without pretending every increase has the same cause.
Use Time-Series Evidence Carefully
Suppose citation coverage rises immediately after a major content initiative.
Organic impressions then rise.
Three weeks later, qualified inquiries increase.
That sequence is interesting.
It may support a hypothesis that stronger content visibility contributed to commercial performance.
But other factors may have changed:
- seasonality;
- branded search demand;
- advertising;
- PR;
- social activity;
- competitors;
- search-engine changes;
- AI model updates.
AI citation patterns can also shift because of changing user behavior, evolving models, freshness signals, partner refresh cycles, and broader changes across the web.
Therefore:
movement together is evidence of association, not automatic proof of causation.
When Causal Measurement Becomes Possible
Some organizations may eventually have enough volume to test interventions more formally.
Time-Based Experiments
Improve a defined content group while maintaining a reasonable comparison group.
Geographic Experiments
Where business conditions permit, vary interventions across markets.
Matched-Content Comparisons
Compare similar topic groups receiving different optimization treatments.
Interrupted Time-Series Analysis
Evaluate whether a measurable change occurs after an intervention while accounting for the prior trend.
These approaches still require careful assumptions.
But they move the question from:
“Did two metrics rise together?”
toward:
“What would likely have happened without the intervention?”
That is the causal question.
What Should a Small Business Measure First?
Most small businesses do not need an elaborate causal-inference program.
Start with a simple monthly measurement table.
Track:
- cited pages;
- citation activity or controlled-prompt citation coverage;
- relevant Search Console impressions;
- organic landing-page sessions;
- visits from articles to commercial pages;
- meaningful CTA events;
- qualified inquiries.
Then segment by topic.
After several months, patterns become easier to evaluate.
Perhaps healthcare analytics articles generate fewer sessions but stronger commercial engagement.
Perhaps AI-search articles generate substantial awareness but limited inquiries.
Perhaps data-engineering articles frequently lead visitors into service pages.
Those are strategically useful observations even before causal estimation becomes practical.
What Success Should Look Like
A weak AI-search report says:
“We received 47 AI citations this month.”
A stronger report says:
“Citation activity increased across our data-quality topic cluster. The same cluster also experienced higher search impressions and increased visits to commercial pages. Qualified inquiries increased during the period, although the observational data does not establish that AI citations caused the increase.”
That statement is less dramatic.
It is also much more analytically defensible.
From AI Visibility to Decision Evidence
AI search adds another discovery surface to the customer journey.
It does not eliminate the fundamentals of measurement.
Businesses still need to distinguish:
exposure from visits;
visits from engagement;
engagement from conversions;
attribution from causality.
The goal should therefore not be to invent one perfect “AI ROI” metric.
The better objective is to construct a chain of evidence showing:
where the business is visible,
which content is being discovered,
how visitors interact with that content,
and
whether commercially meaningful outcomes are appearing alongside those changes.
AI citations become valuable when they are treated as one observable part of a broader decision system—not as the final business outcome.
References
Want to Connect Visibility With Business Outcomes?
UAD Consulting helps organizations connect search, digital analytics, website behavior, and business outcomes into measurement frameworks designed for better decisions.
Explore ServicesGet in Touch