Regression Modeling & Marketing Mix Analytics
Using regression to quantify business relationships and build the statistical foundation for marketing mix analysis.
This project explores how regression analysis can be used to quantify relationships between sales and key business drivers. A log-log multiple regression specification is used to examine sales in relation to price, competitor price, income, and advertising while demonstrating coefficient interpretation, statistical significance, model fit, and elasticity.
Quantifying the Drivers of Sales
Descriptive visualization can reveal patterns, but regression allows multiple variables to be evaluated simultaneously. The analytical question is: how is sales performance associated with price, competitor pricing, consumer income, and advertising when these factors are considered together?
The model controls for multiple observed variables simultaneously, allowing each coefficient to represent a conditional association holding the other included predictors constant. These estimates should be interpreted as associations rather than causal effects.
A Log-Log Regression Model
The logarithmic specification is useful because coefficients in a log-log model can be interpreted as elasticities.
log(Sales) = β₀ + β₁ log(Price) + β₂ log(Competitor Price) + β₃ log(Income) + β₄ log(Advertising) + εFor example, a coefficient of -0.67 on log(Price) means that, holding the other included variables constant, a 1% increase in price is associated with approximately a 0.67% decrease in sales. This provides an intuitive business interpretation of regression coefficients.
Estimating the Model in R
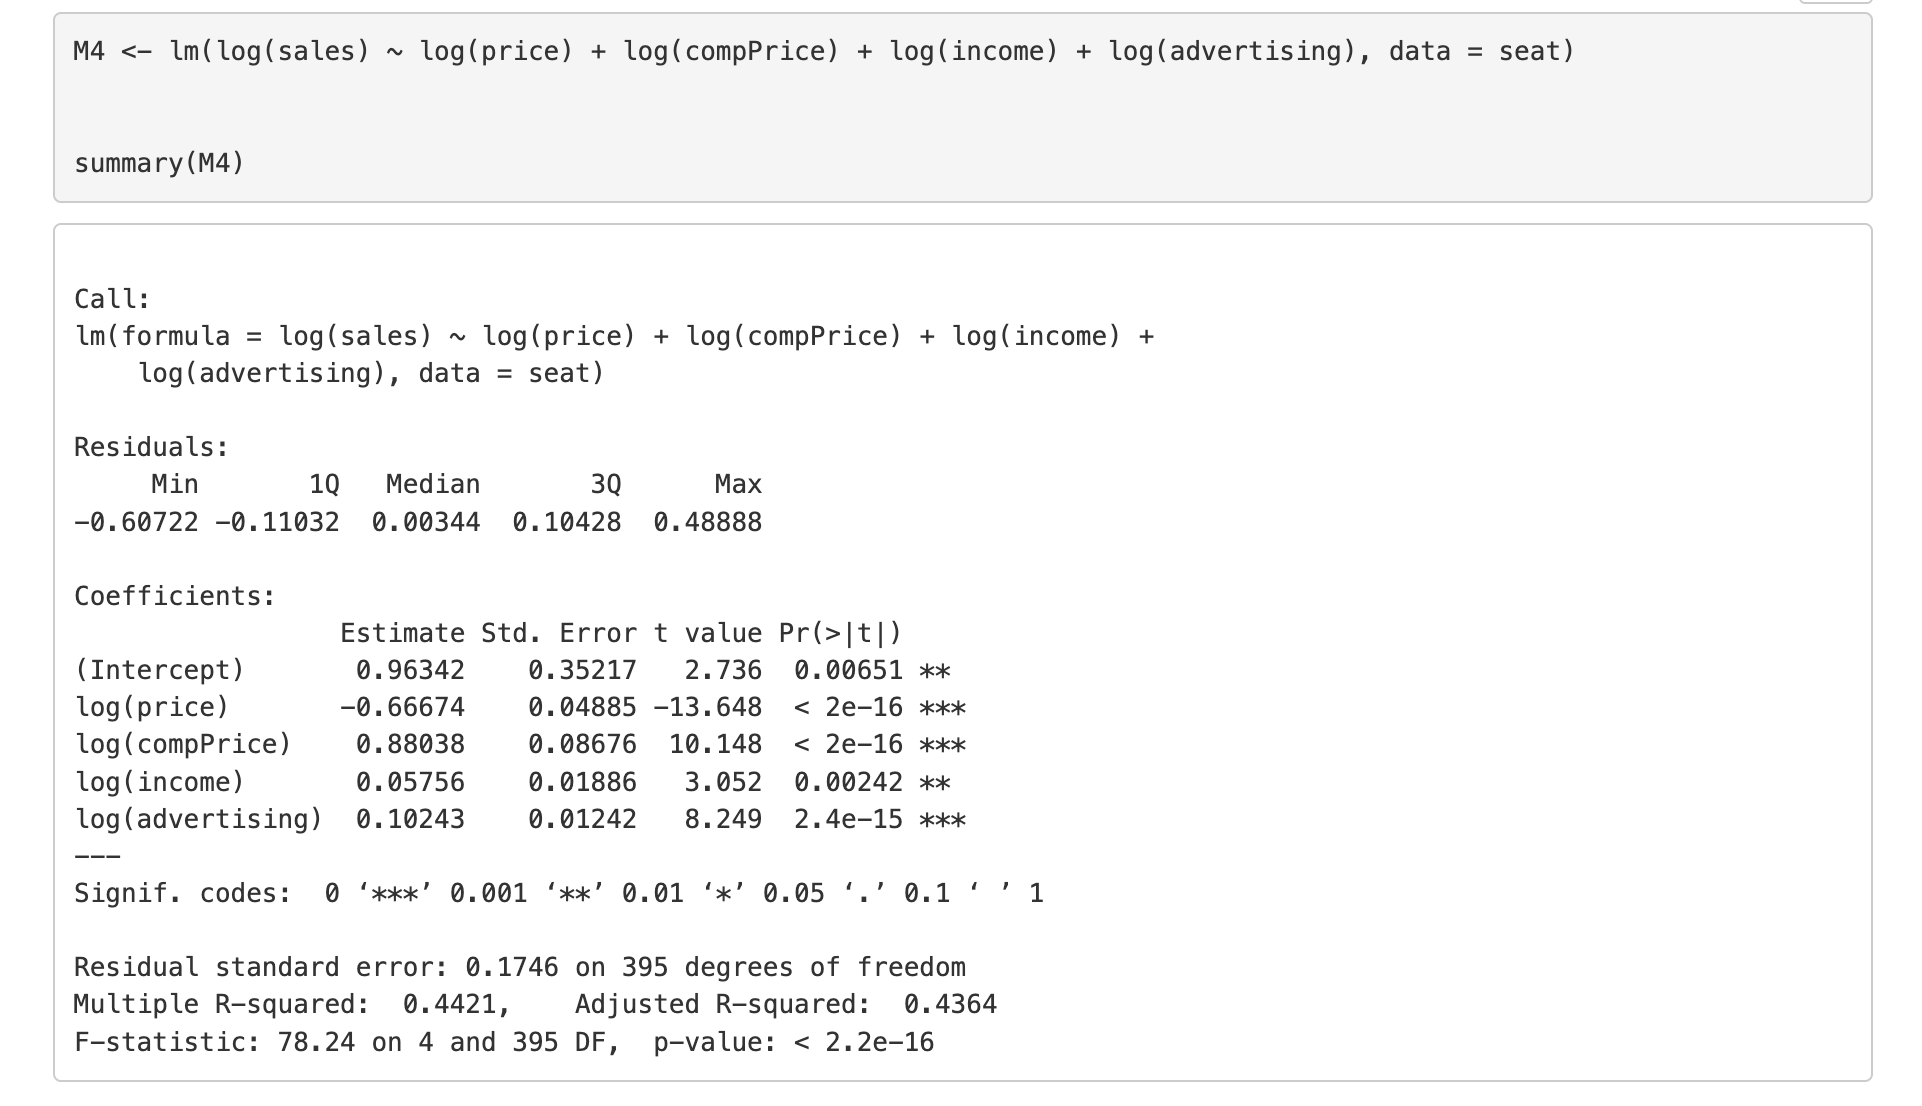
The model was estimated using R's lm() function:
lm(log(sales) ~ log(price) + log(compPrice) + log(income) + log(advertising), data = seat)summary() provides coefficient estimates, standard errors, t-statistics, p-values, residual information, R-squared, adjusted R-squared, and the F-statistic.
From Coefficients to Business Meaning
Price Elasticity
Holding competitor price, income, and advertising constant, a 1% increase in price is associated with approximately a 0.67% decrease in sales.
Competitive Pricing Relationship
Holding the other included variables constant, a 1% increase in competitor price is associated with approximately a 0.88% increase in sales.
Income Relationship
Holding the other included variables constant, a 1% increase in income is associated with approximately a 0.06% increase in sales.
Advertising Elasticity
Holding price, competitor price, and income constant, a 1% increase in advertising is associated with approximately a 0.10% increase in sales.
Evaluating Model Performance
The model explains approximately 44% of the observed variation in log sales within this dataset. The overall F-test provides evidence that the included predictors are jointly associated with the dependent variable. R² should be interpreted in the context of the dataset, model specification, measurement quality, and analytical purpose rather than as inherently good or bad.
From Regression to Marketing Mix Modeling
Multiple regression provides much of the statistical intuition behind traditional Marketing Mix Modeling. MMM extends this framework to estimate how marketing channels and other business drivers relate to outcomes such as sales or revenue over time.
Sales = Base Demand + Paid Search + Paid Social + TV + Display + Promotions + Pricing + Seasonality + External Factors + ErrorA practical MMM requires more than simply inserting marketing spend into a linear regression. It typically considers time-series structure, media transformations, lagged effects, adstock, saturation, seasonality, trend, promotions, and external factors.
Marketing Effects Are Rarely Instant or Linear
Adstock — Carryover Effects
Advertising exposure can continue influencing outcomes after the initial media spend occurs. Adstock transformations represent this carryover effect.
Media Spend → Current Effect → Carryover → Decaying Future Effect
Adstock is described here as an MMM extension; it was not implemented in the supplied regression.
Saturation — Diminishing Returns
The incremental impact of advertising typically decreases as spending increases. Saturation functions allow MMMs to represent diminishing marginal returns.
Low Spend → Strong Response
Medium Spend → Moderate Response
High Spend → Diminishing Response
Saturation is described here as an MMM extension; it was not implemented in the supplied regression.
Separating Marketing from Other Business Drivers
Marketing performance cannot be evaluated in isolation. A robust MMM may control for price, promotions, seasonality, trend, competitor activity, macroeconomic conditions, holidays, distribution changes, and product availability. Omitted factors can distort the estimated relationship between media investment and business outcomes.
How MMM Supports Decision-Making
These outputs can support questions such as how much observed performance is associated with different marketing channels, how marginal return changes as spending increases, and where additional budget might generate stronger incremental response. MMM does not automatically identify a mathematically perfect budget allocation.
MMM vs Digital Attribution
Marketing Mix Modeling
Aggregate-level; can include offline and online media; often weekly or monthly time series; does not require user-level tracking; designed to estimate broader channel contribution.
Digital Attribution
User/event-level; primarily digital touchpoints; uses paths, clicks, sessions, and conversions; more granular; dependent on available tracking infrastructure.
These approaches answer related but different measurement questions and can complement one another rather than serving as direct substitutes.
Techniques Demonstrated
Connecting Statistical Models to Business Decisions
Regression becomes valuable in business analytics when statistical estimates can be translated into interpretable relationships. Elasticities, competitive effects, and advertising response provide a bridge between statistical modeling and questions involving pricing, marketing investment, forecasting, and resource allocation.
Marketing Mix Modeling extends this reasoning by incorporating time, media dynamics, diminishing returns, and external business drivers to support strategic marketing measurement.