Exploratory Data Analysis & Visualization in R
Exploring, analyzing, and communicating data through reproducible R workflows.
This project demonstrates an R-based exploratory analysis workflow combining data transformation, statistical visualization, and reproducible reporting. Using ggplot2 and supporting R packages, multiple datasets were explored through distributions, relationships, categorical comparisons, faceted views, regression trends, and text-based visualization.
Reproducible Analysis with R Markdown
R Markdown was used to combine analytical code, visualization output, and written interpretation within a single reproducible workflow. Analysis logic remains connected to its output, visualizations can be regenerated when data changes, code and documentation remain together, and results can be communicated in a structured report.
Exploring Relationships Across Groups
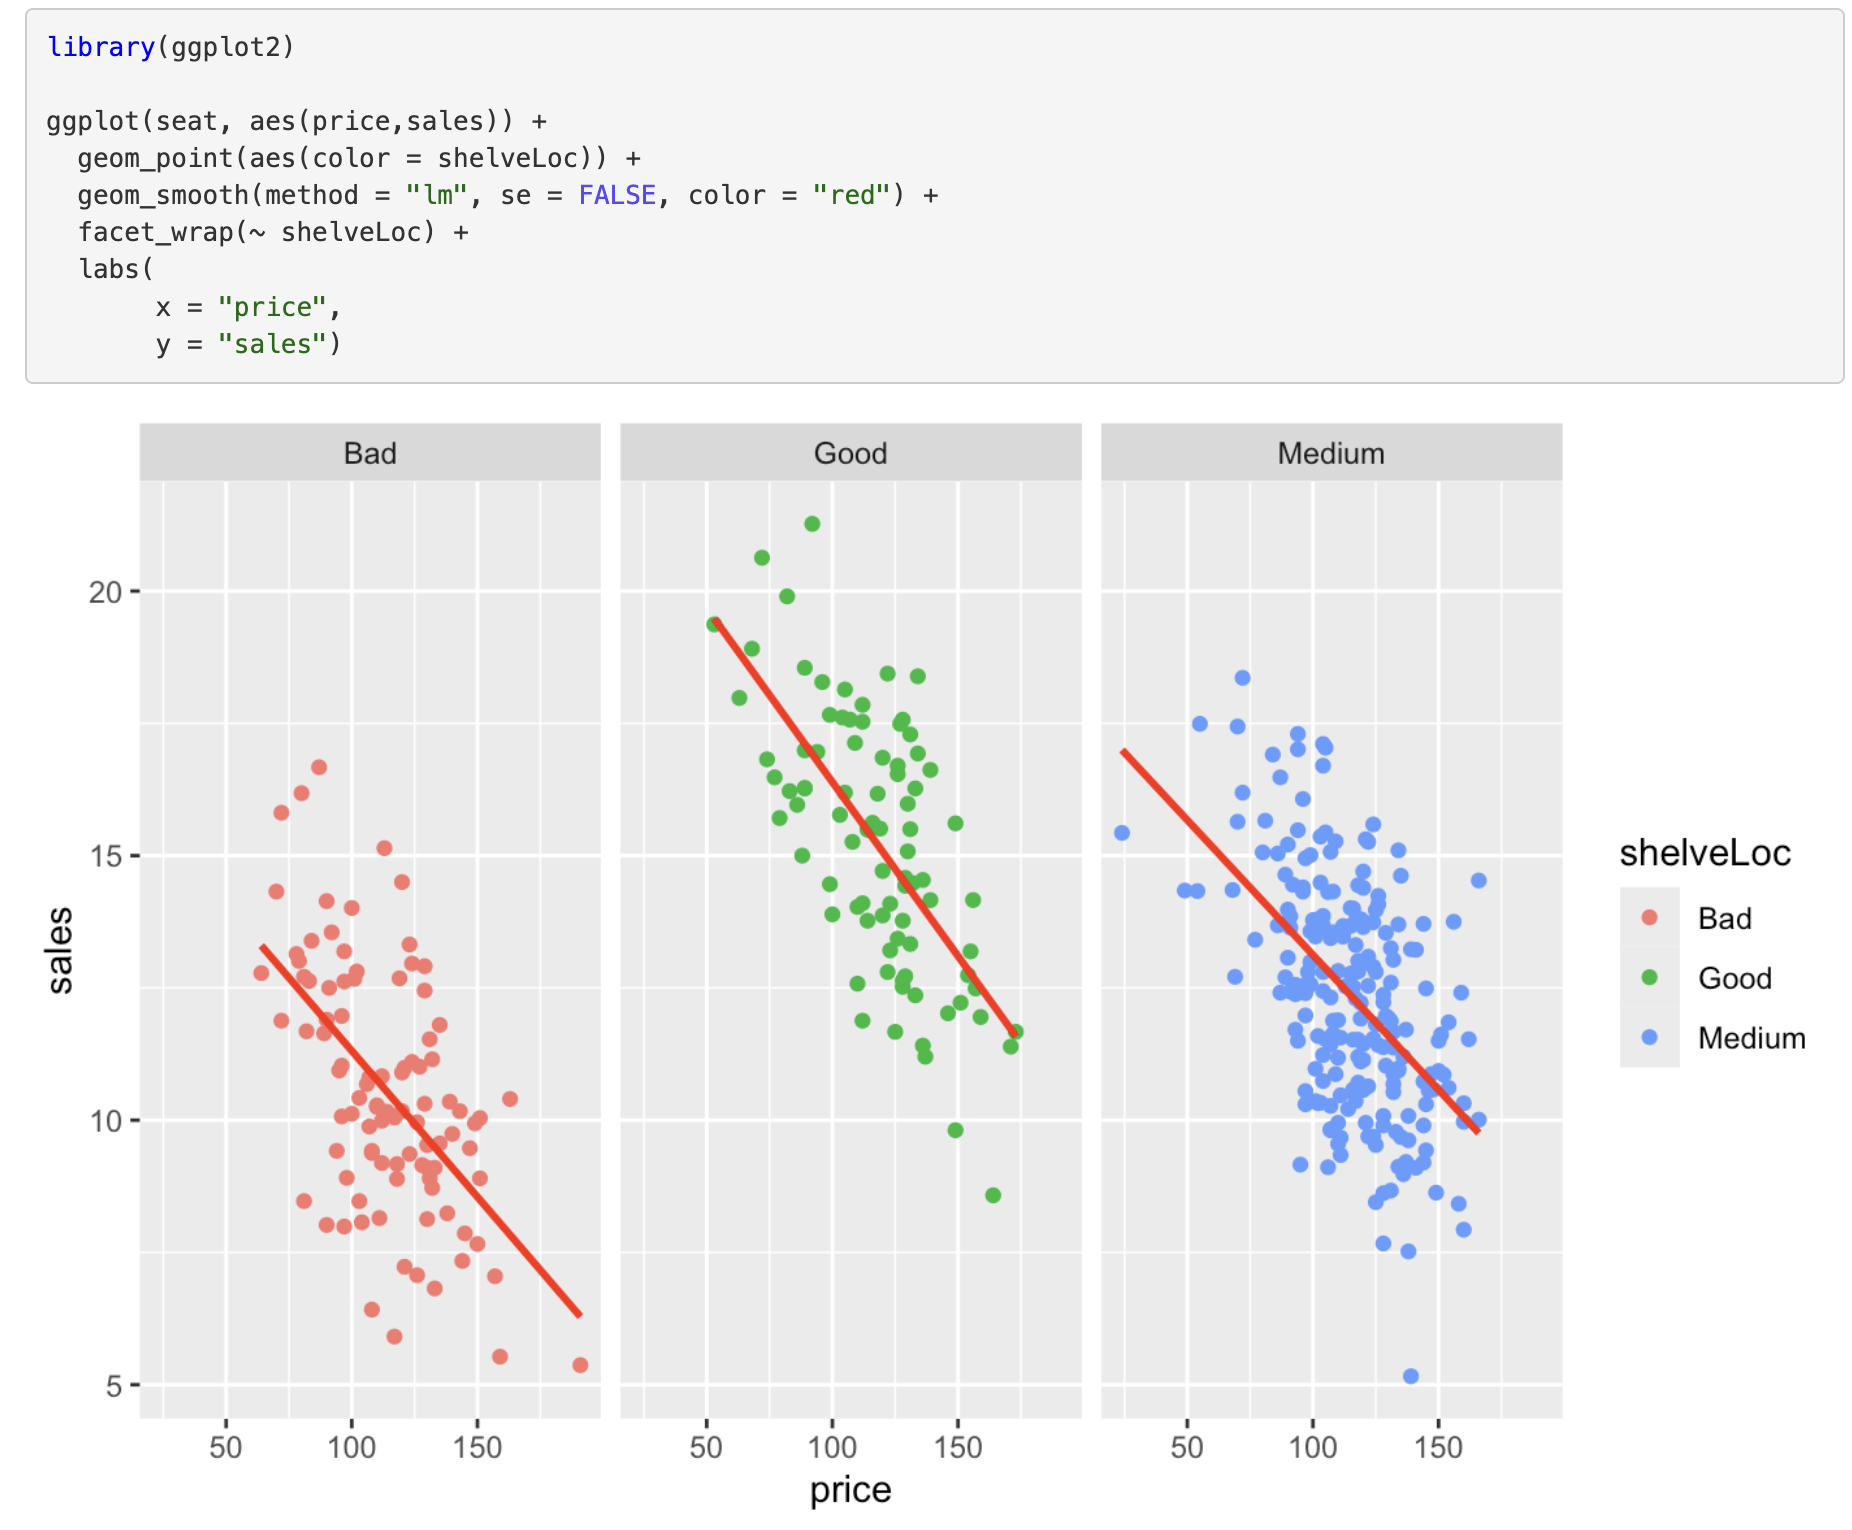
The visualization examines the relationship between price and sales across different shelf-location categories. It demonstrates scatterplots, grouped observations, color encoding, faceting, linear trend estimation, and comparison of relationships across categories.
facet_wrap() separates observations into comparable panels while geom_smooth(method = "lm") overlays linear trend lines. These views support comparison without implying statistical significance or causality from visualization alone.
Understanding Data Distributions
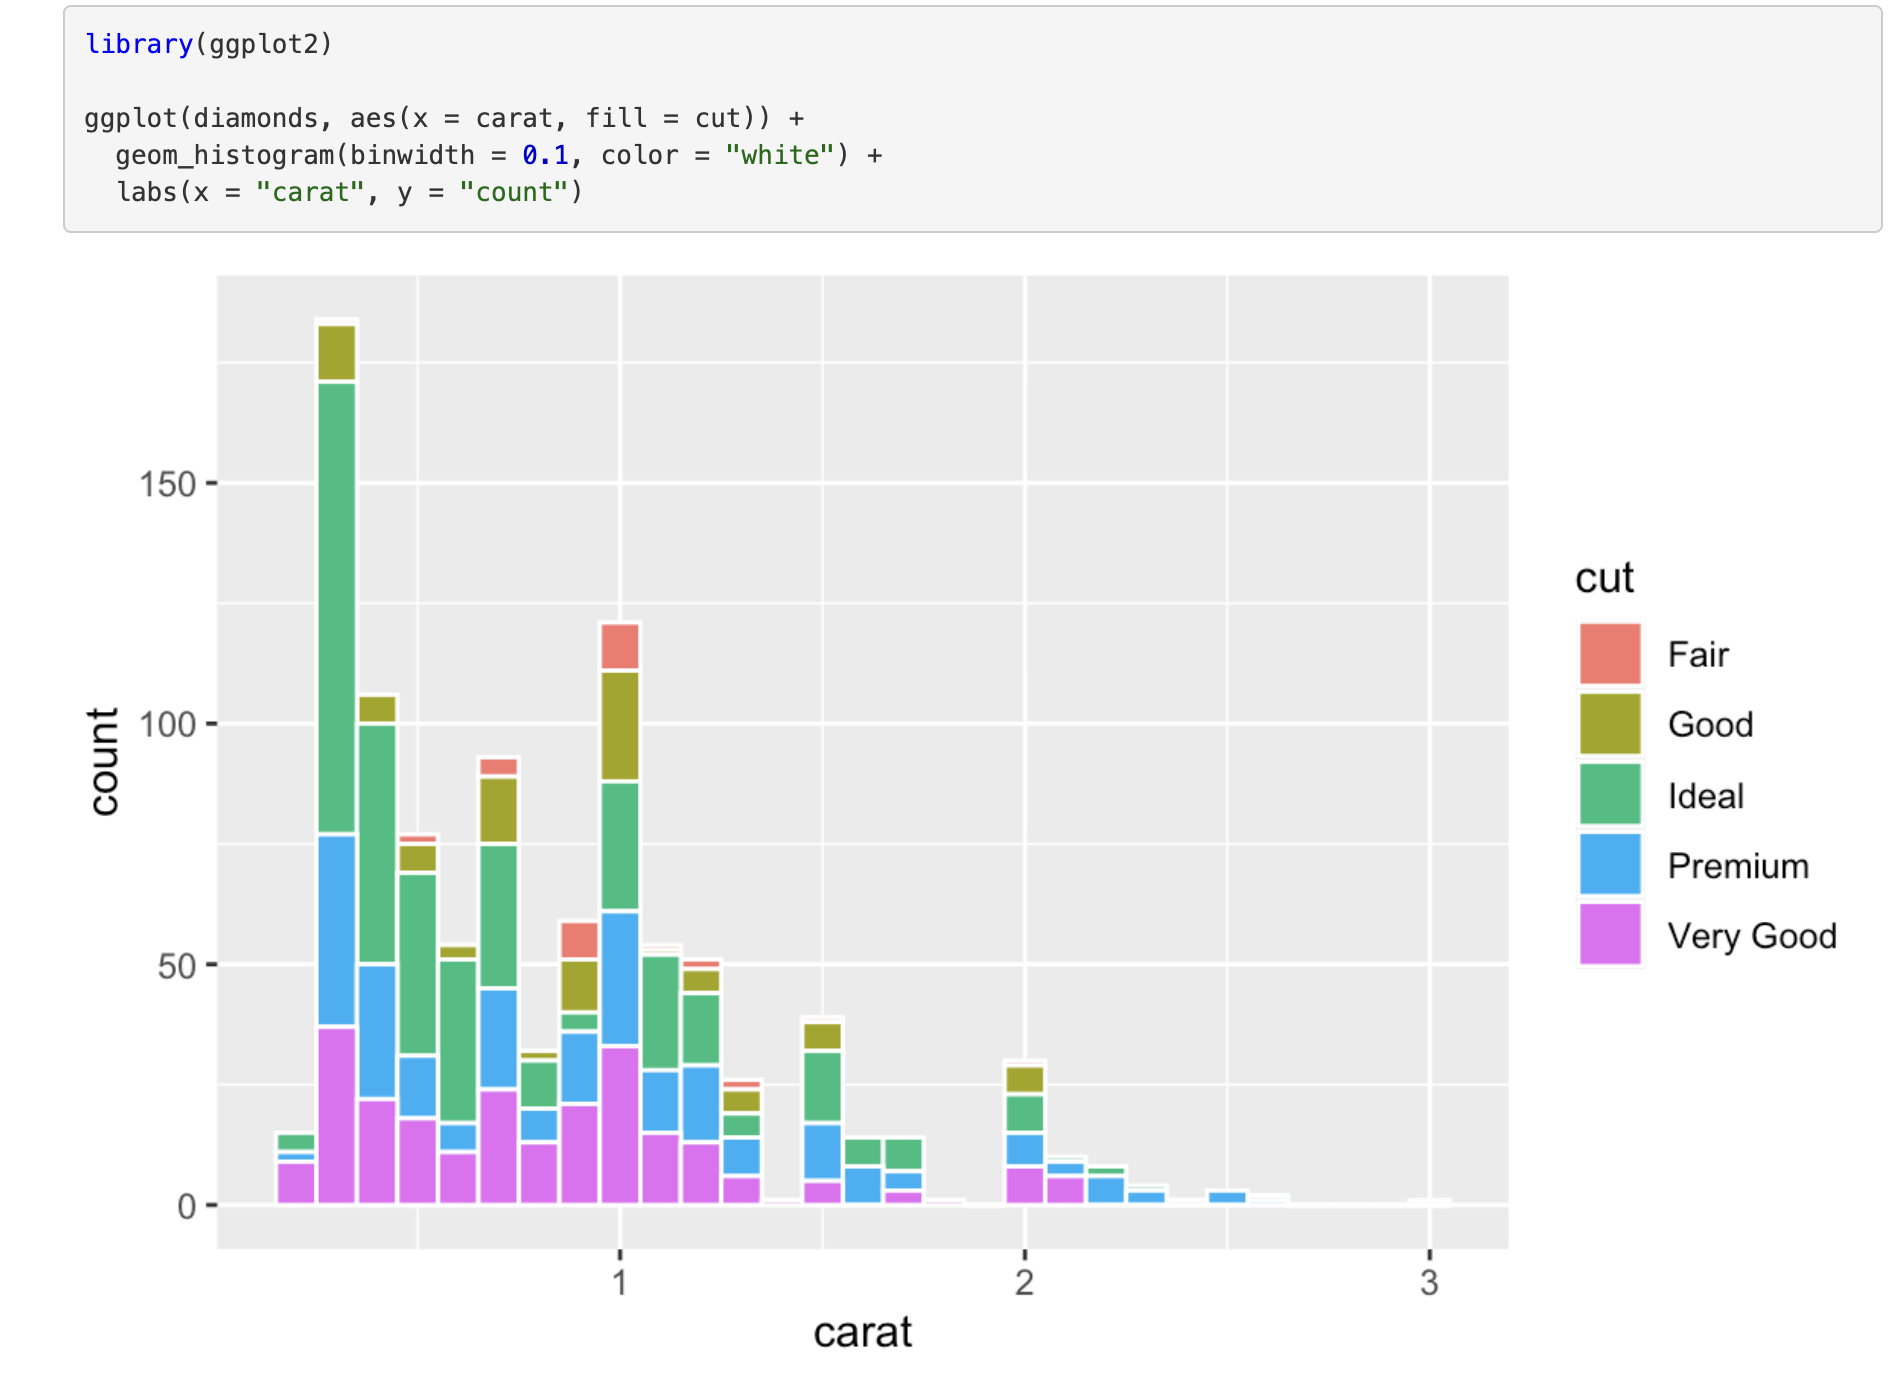
The histogram explores the distribution of diamond carat values while using cut categories as an additional visual dimension. It demonstrates binning, distribution analysis, and categorical grouping.
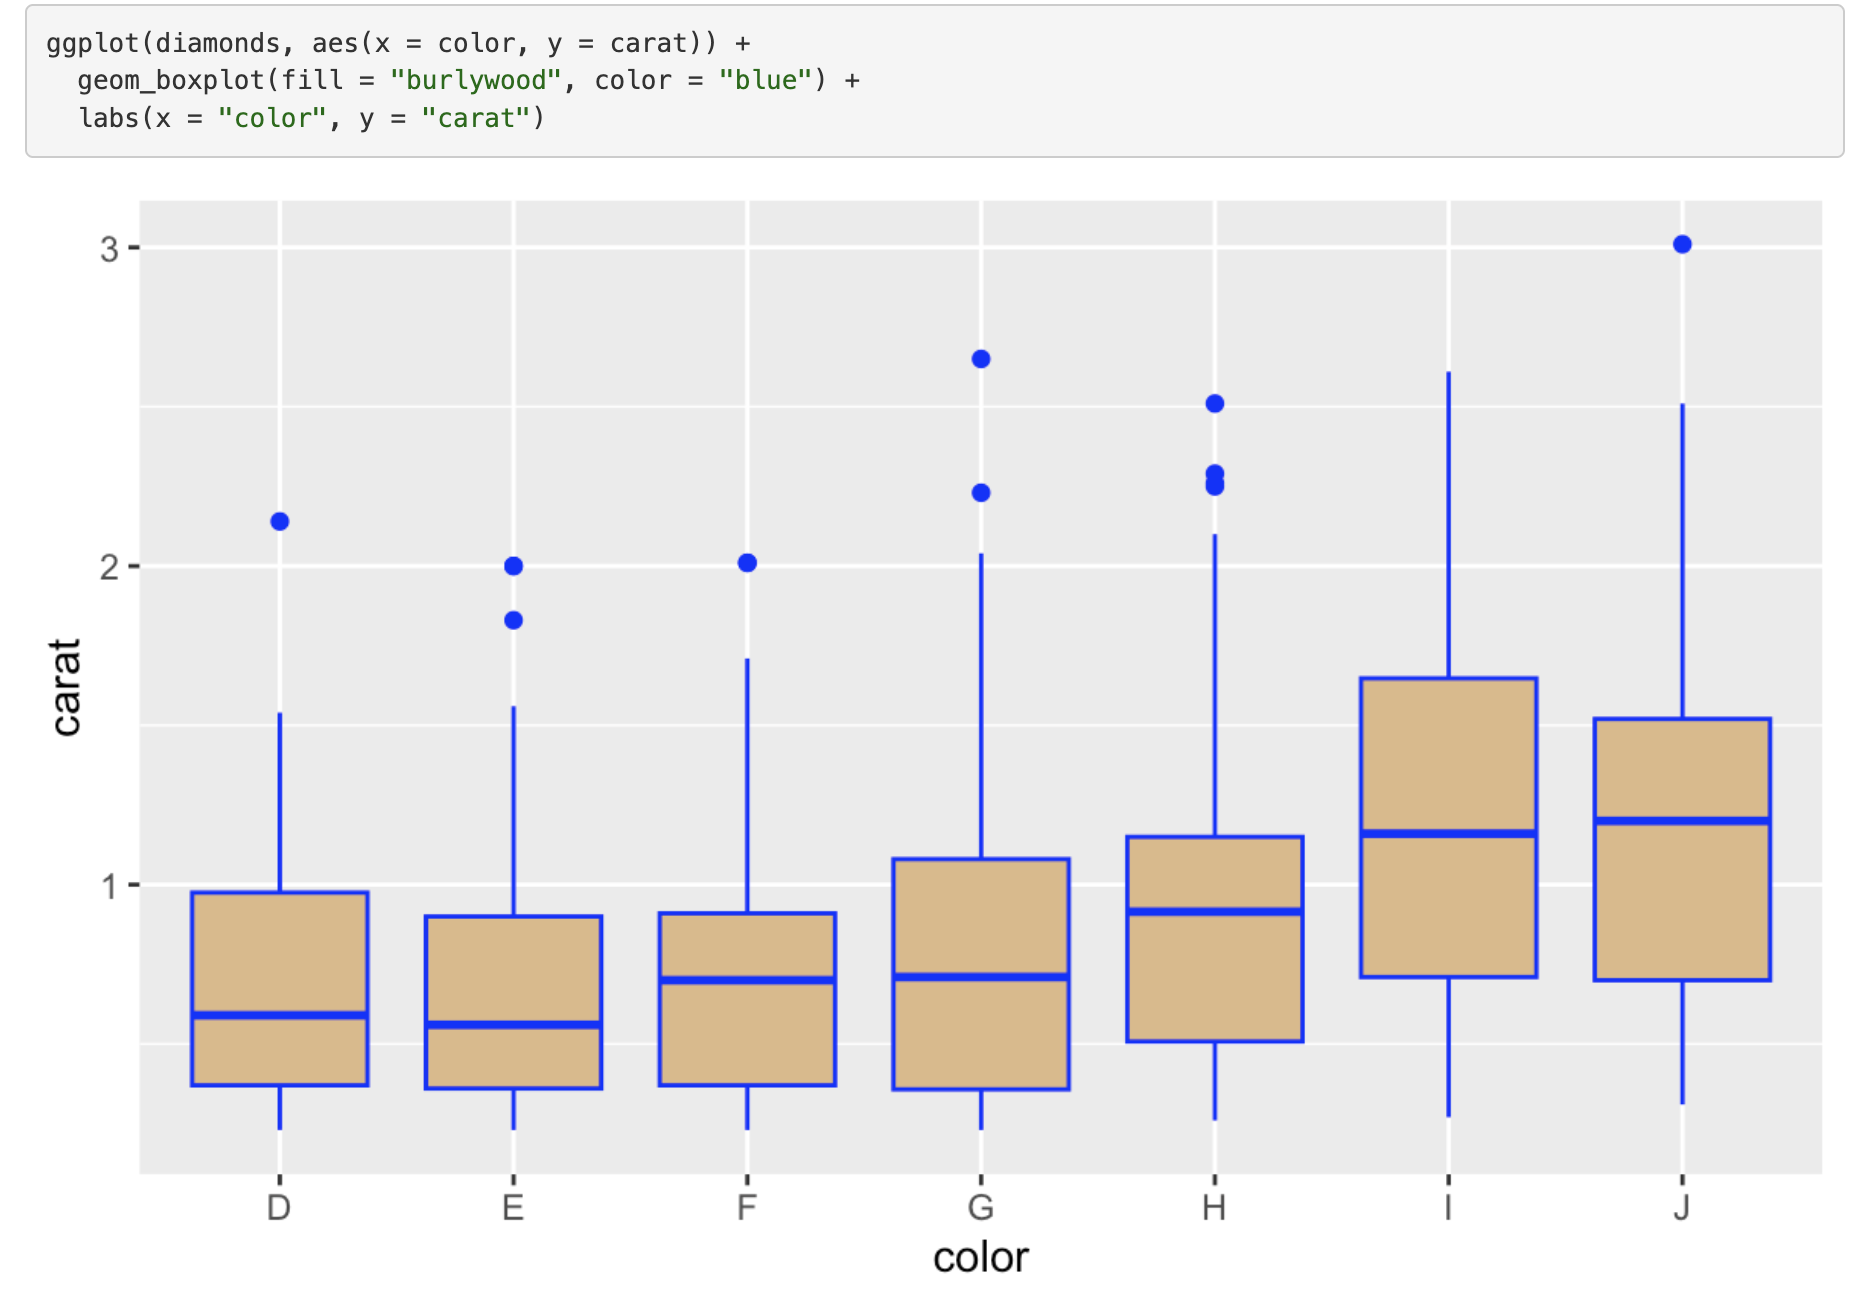
The boxplot compares carat distributions across diamond color categories. Boxplots allow an analyst to examine medians, interquartile ranges, spread, potential outliers, and differences across categories.
Comparing Categorical Patterns
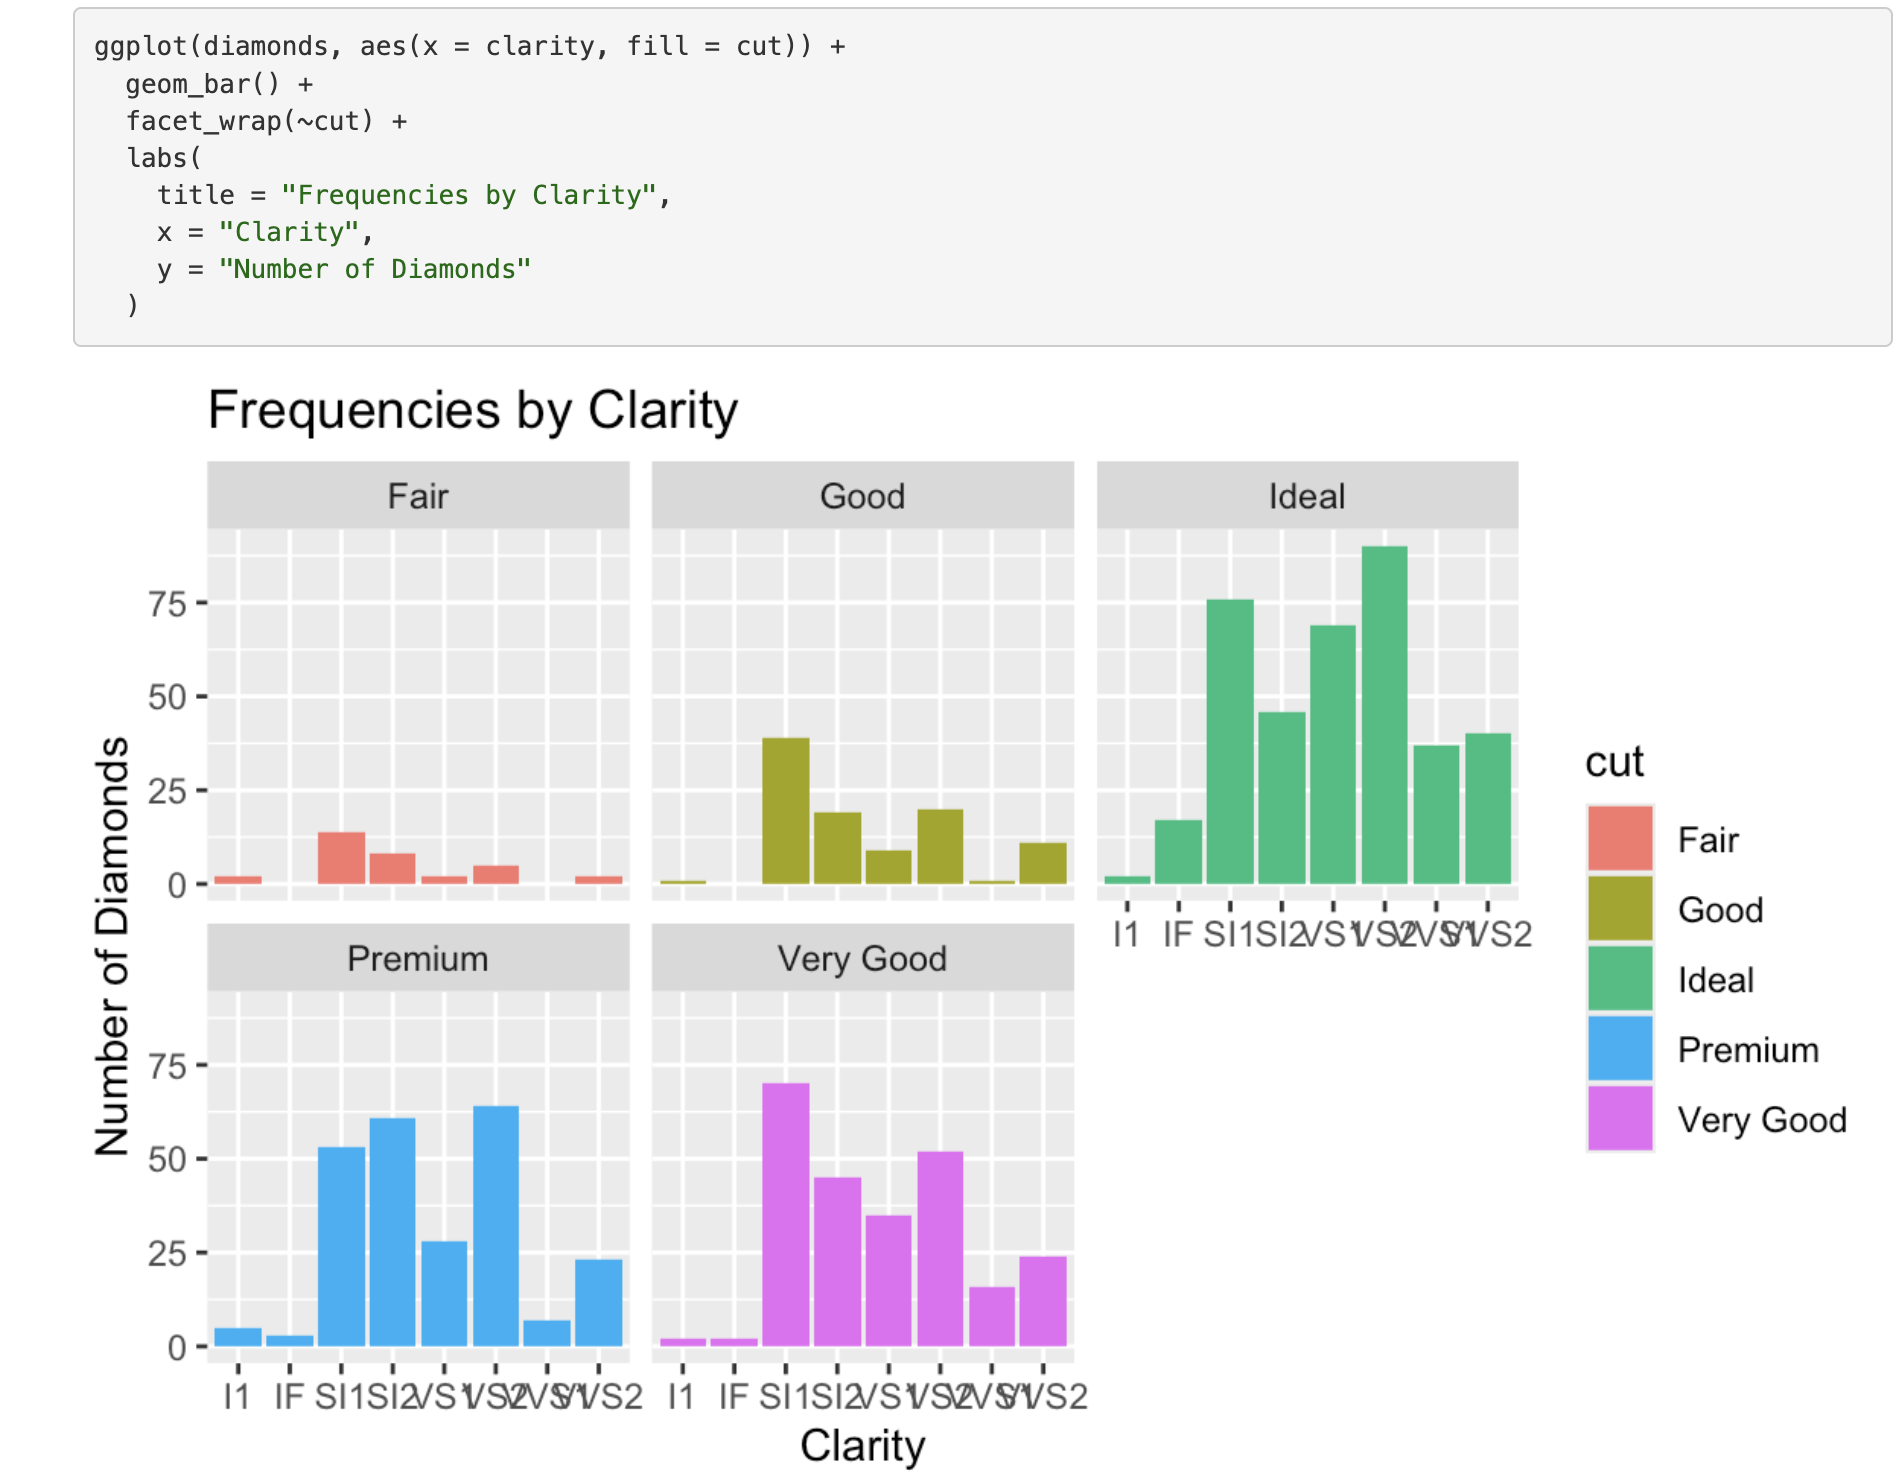
This visualization examines diamond clarity frequencies while separating observations by cut category. It demonstrates geom_bar(), facet_wrap(), categorical frequency analysis, small-multiple visualization, and subgroup comparison.
Faceting allows the same measure to be compared across multiple groups while preserving a consistent visual structure, making differences in categorical distributions easier to identify.
Exploring Unstructured Text
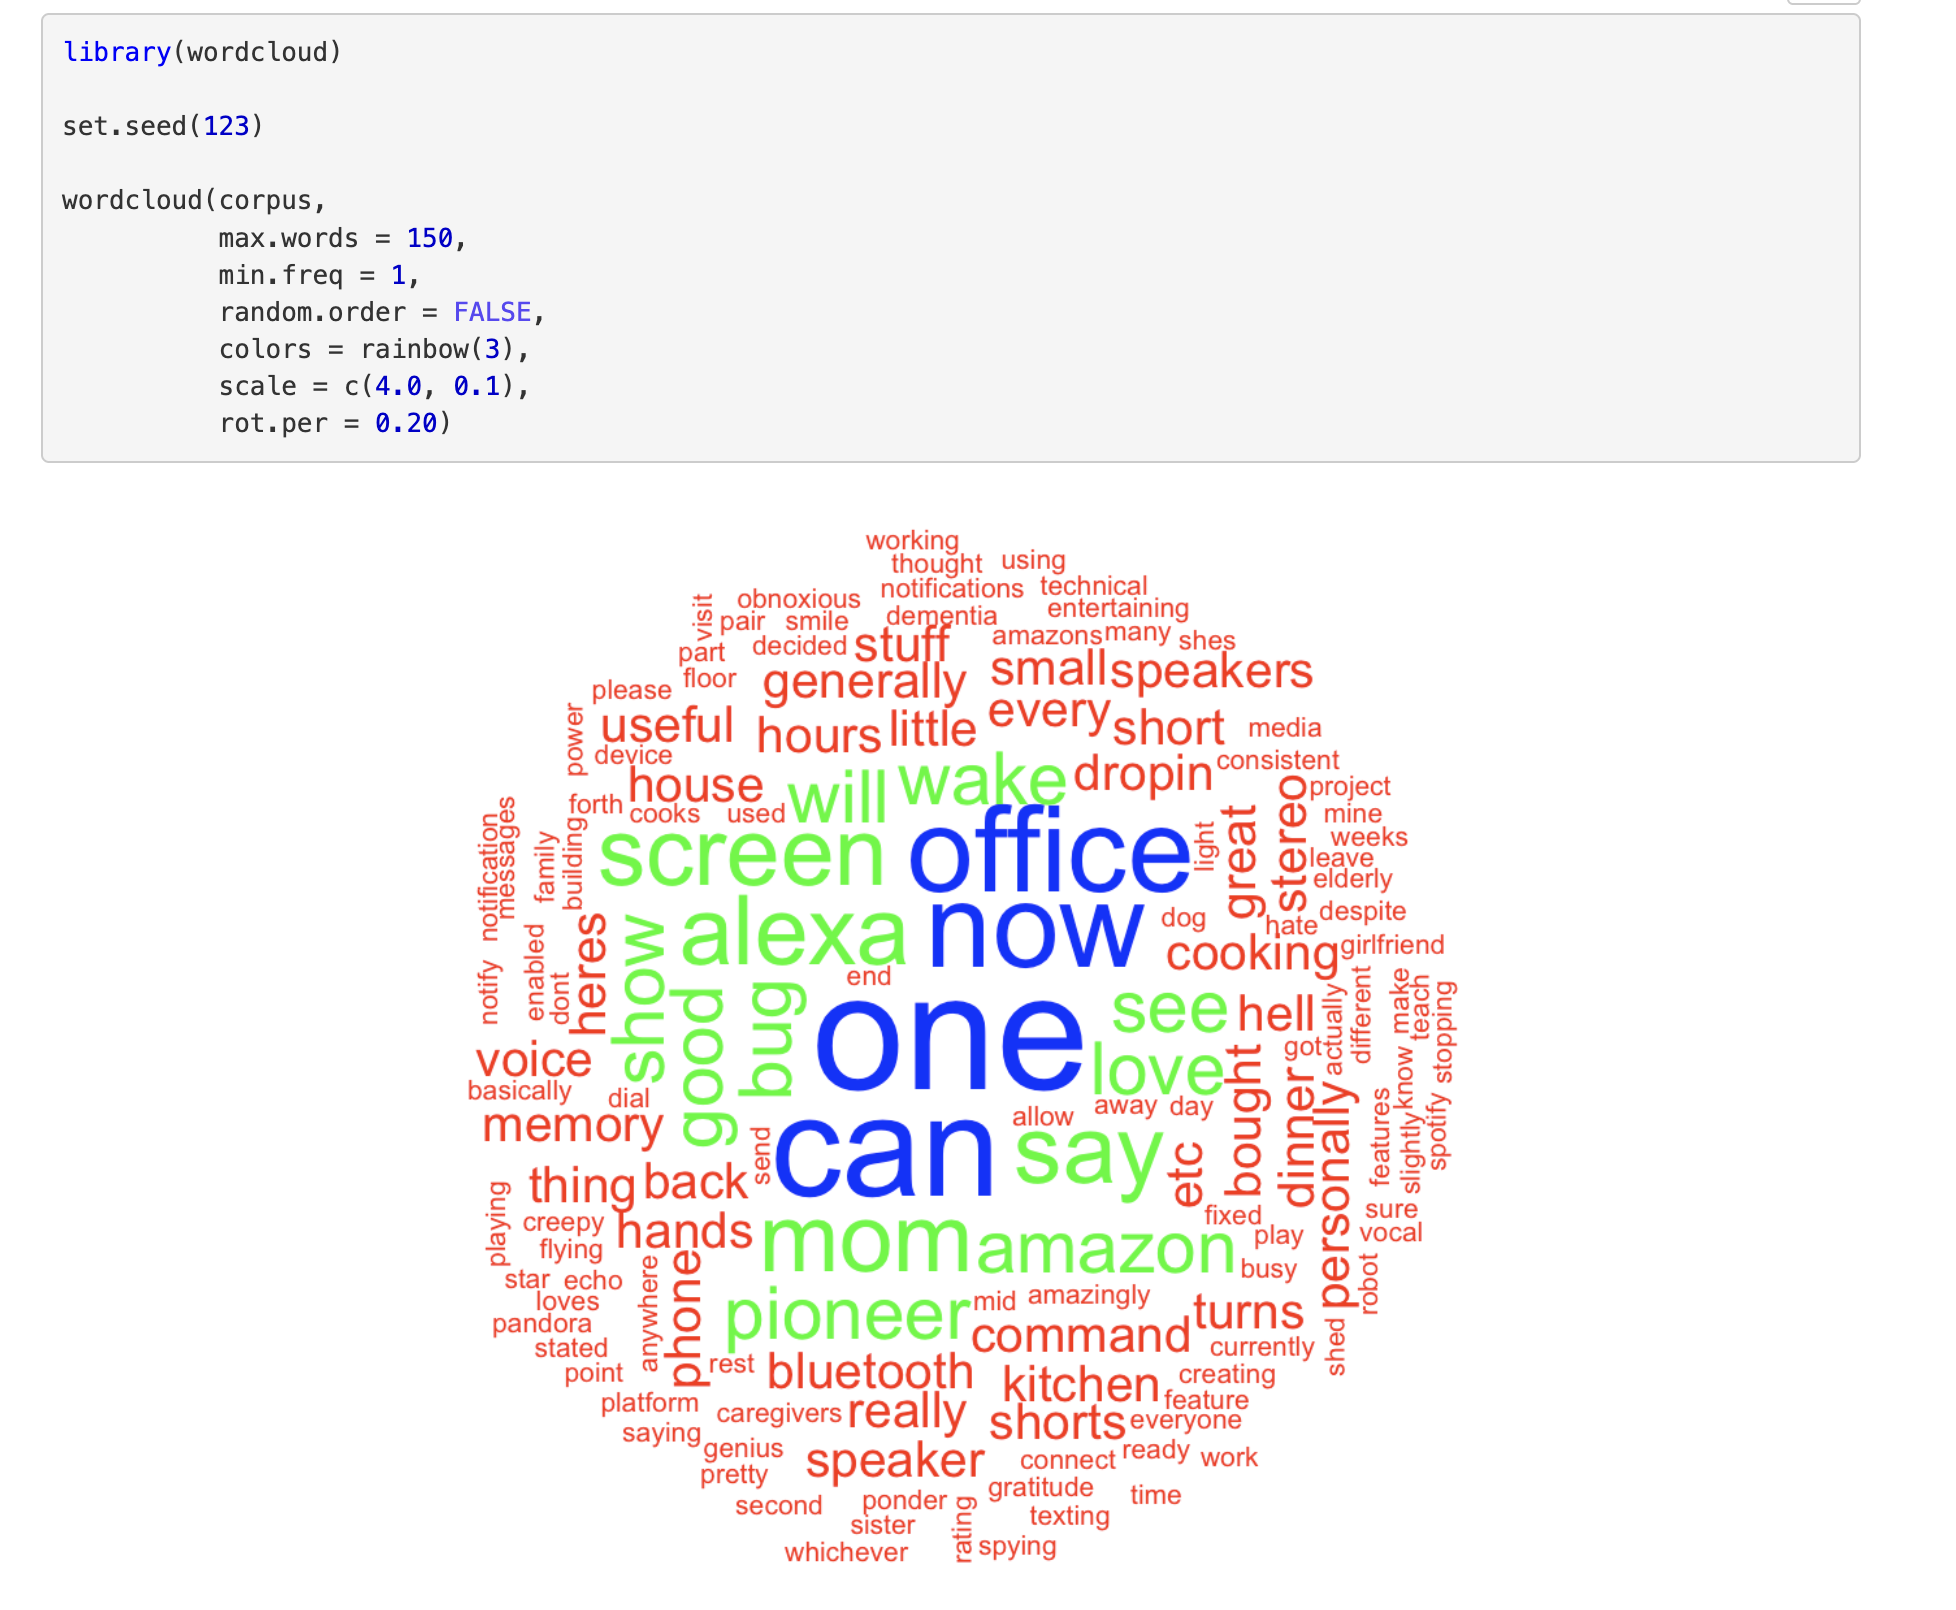
R was also used to explore textual information using the wordcloud package. Text visualization can provide an initial exploratory view of frequently occurring terms in unstructured text.
Word clouds provide a lightweight exploratory view of term frequency and can serve as an initial step before more structured text-analysis techniques. They are not a substitute for rigorous natural-language processing.
From Data to Insight
Techniques Demonstrated
Why Reproducible Analysis Matters
Exploratory analysis is often the bridge between raw data and formal modeling. R provides a flexible environment for examining distributions, detecting unusual observations, comparing groups, exploring relationships, and communicating analytical findings.
These workflows support the early stages of business analytics by helping analysts understand the structure and behavior of data before building statistical models, dashboards, or decision-support systems.