Chicago Airbnb Market Analysis
Pricing, Occupancy & Host Market Dynamics
An exploratory market analysis examining how property characteristics, occupancy patterns, location, and host scale shape Chicago's short-term rental market.
Understanding Chicago's Airbnb Market
The analysis explores how Airbnb property characteristics and host profiles relate to pricing and occupancy across Chicago. Rather than looking at price alone, the project examines property configuration, occupancy intensity, neighborhood patterns, and host concentration to develop a more complete view of the market.
The analysis focuses on three broad questions:
- How do property characteristics such as bedrooms and bathrooms relate to pricing?
- What characteristics distinguish high-occupancy listings?
- How concentrated is Airbnb hosting across professional and smaller-scale hosts in Chicago?
Pricing & Property Characteristics
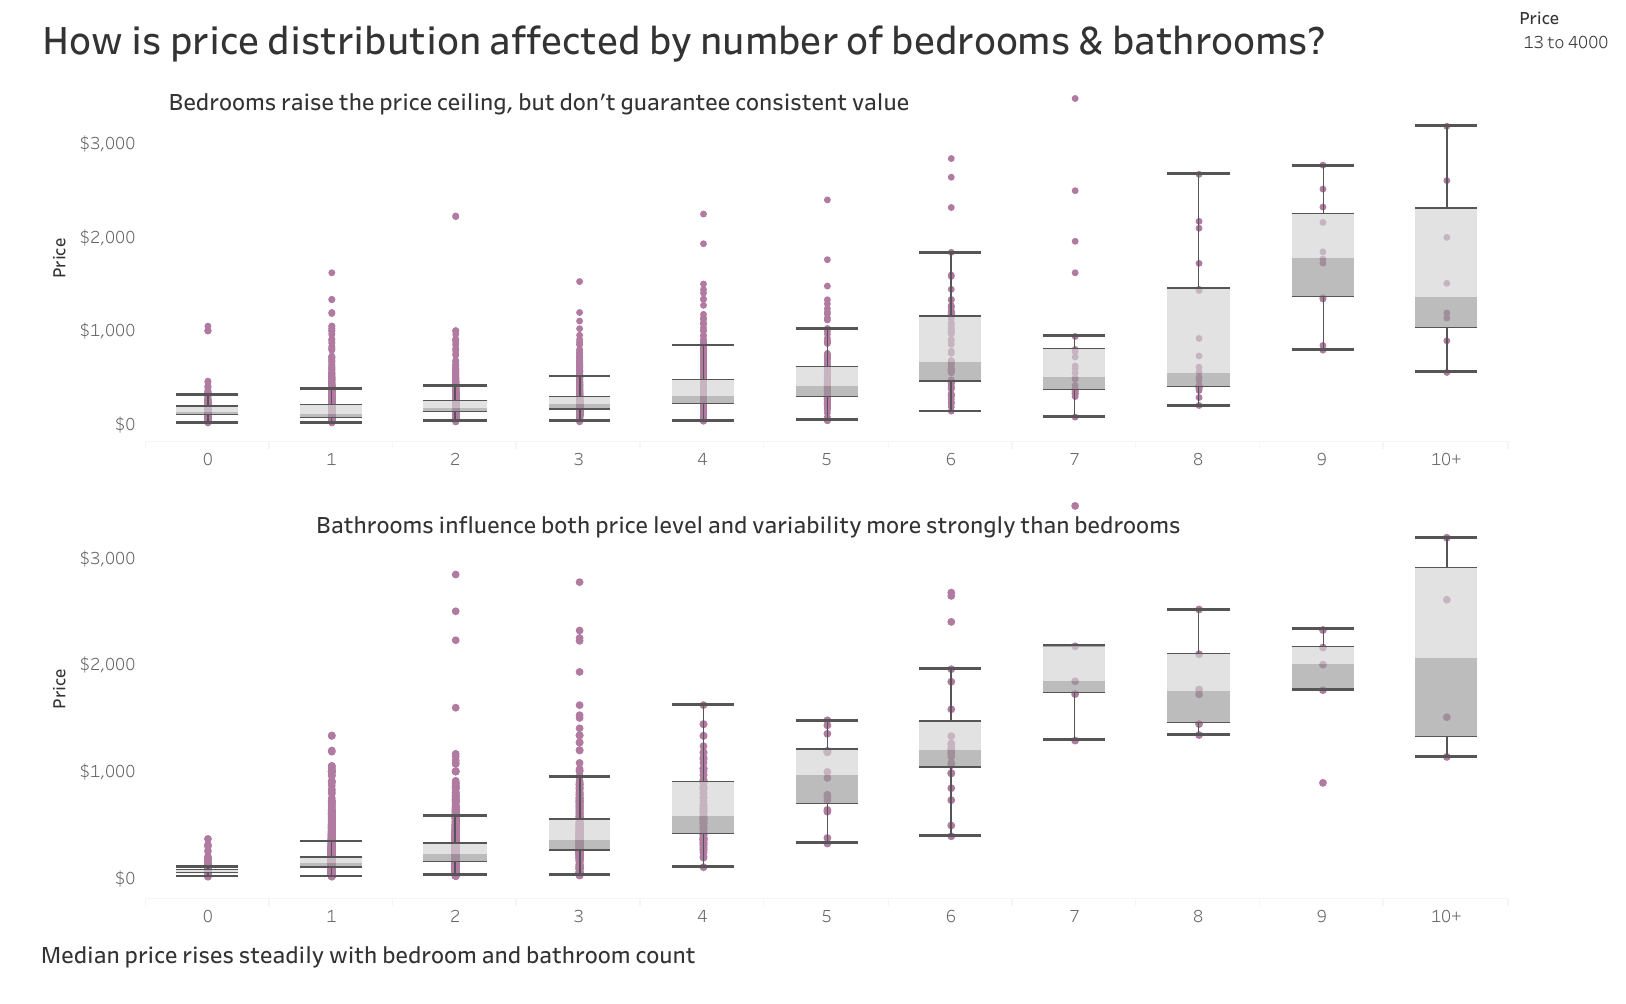
The pricing analysis examines how Airbnb prices vary as the number of bedrooms and bathrooms increases. Distributional views are used instead of relying only on averages, making it possible to see differences in median prices, variability, and extreme listings.
Defining High Occupancy
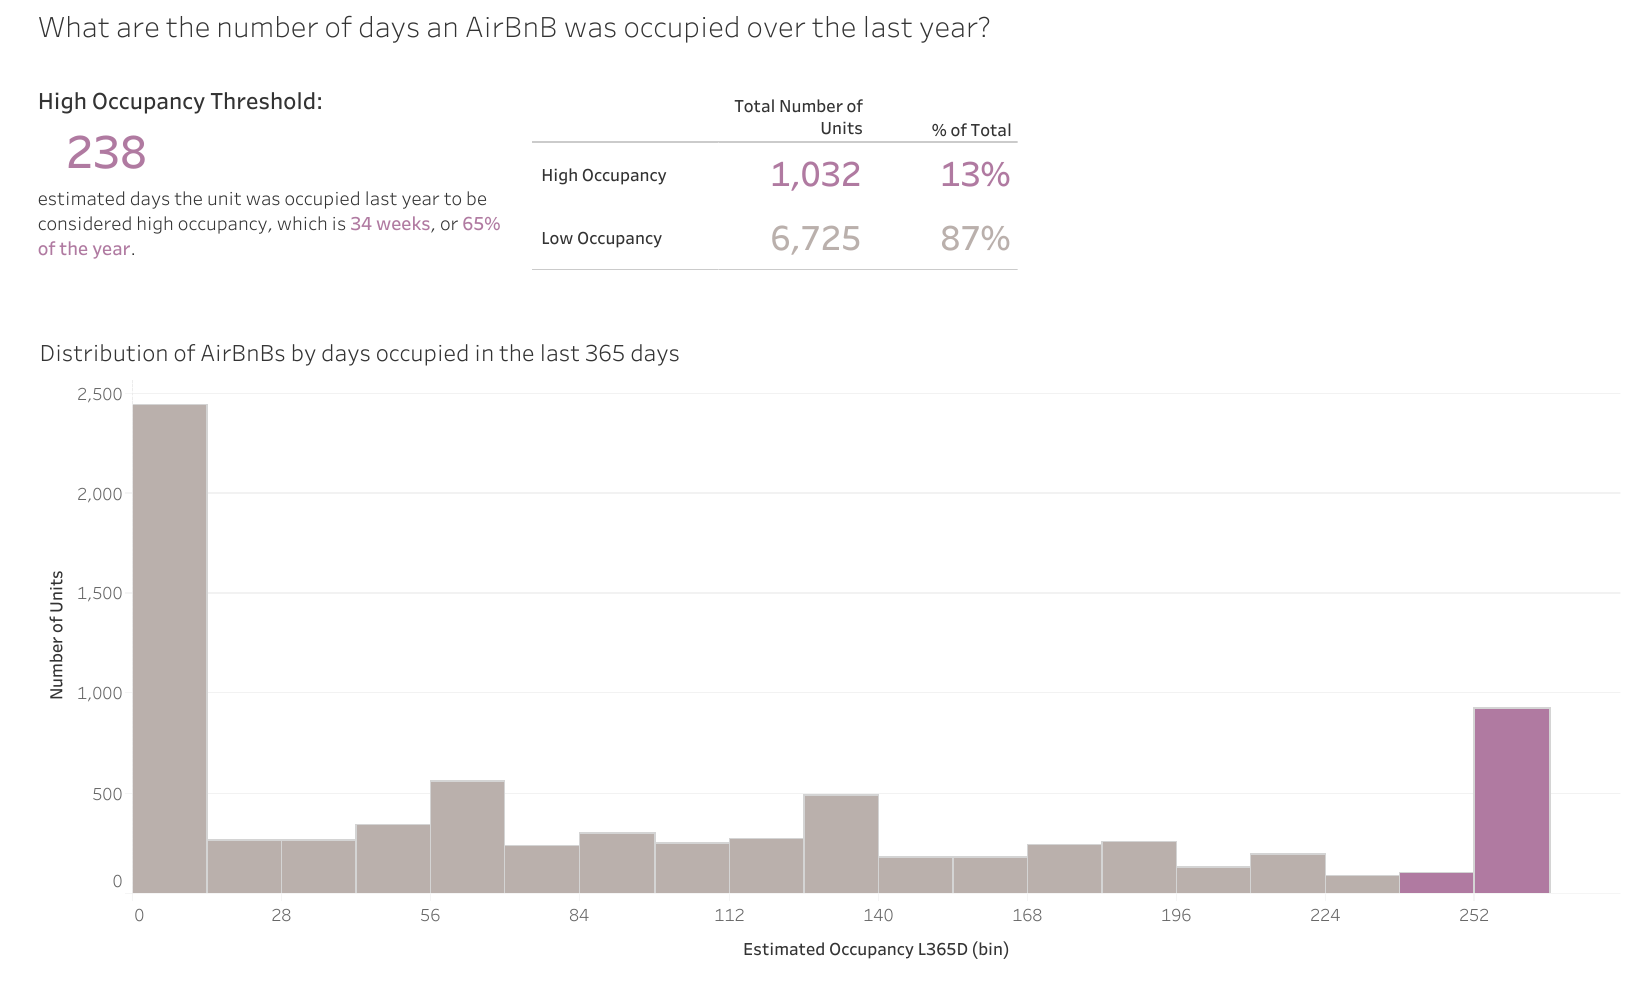
To compare stronger- and weaker-occupancy listings consistently, the analysis defines a high-occupancy threshold of 238 estimated occupied days per year, equivalent to approximately 65% of the year.
These values describe the dataset analyzed in this project and are not claims about the entire current Chicago Airbnb market.
What Does a High-Occupancy Listing Look Like?
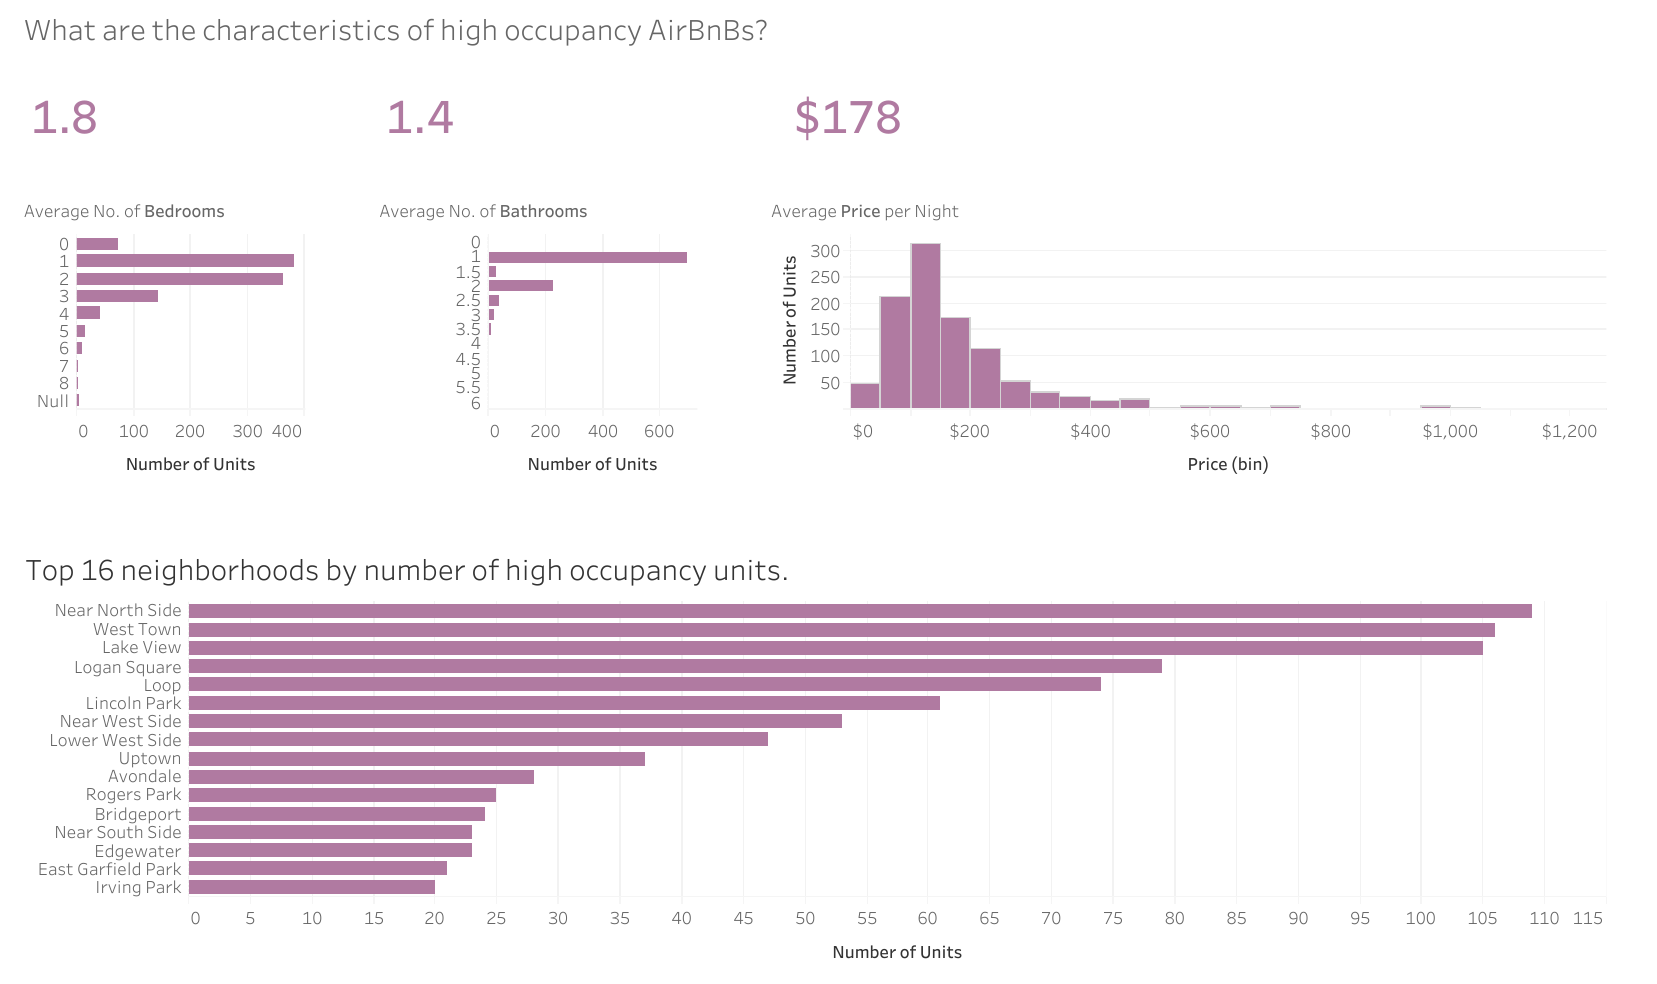
The high-occupancy segment is concentrated among relatively compact properties rather than the largest listings in the dataset. The dashboard combines property configuration, nightly pricing, and neighborhood distribution to build a profile of listings that exceeded the project's occupancy threshold.
These characteristics describe the analyzed dataset and should not be generalized beyond it.
Location Matters
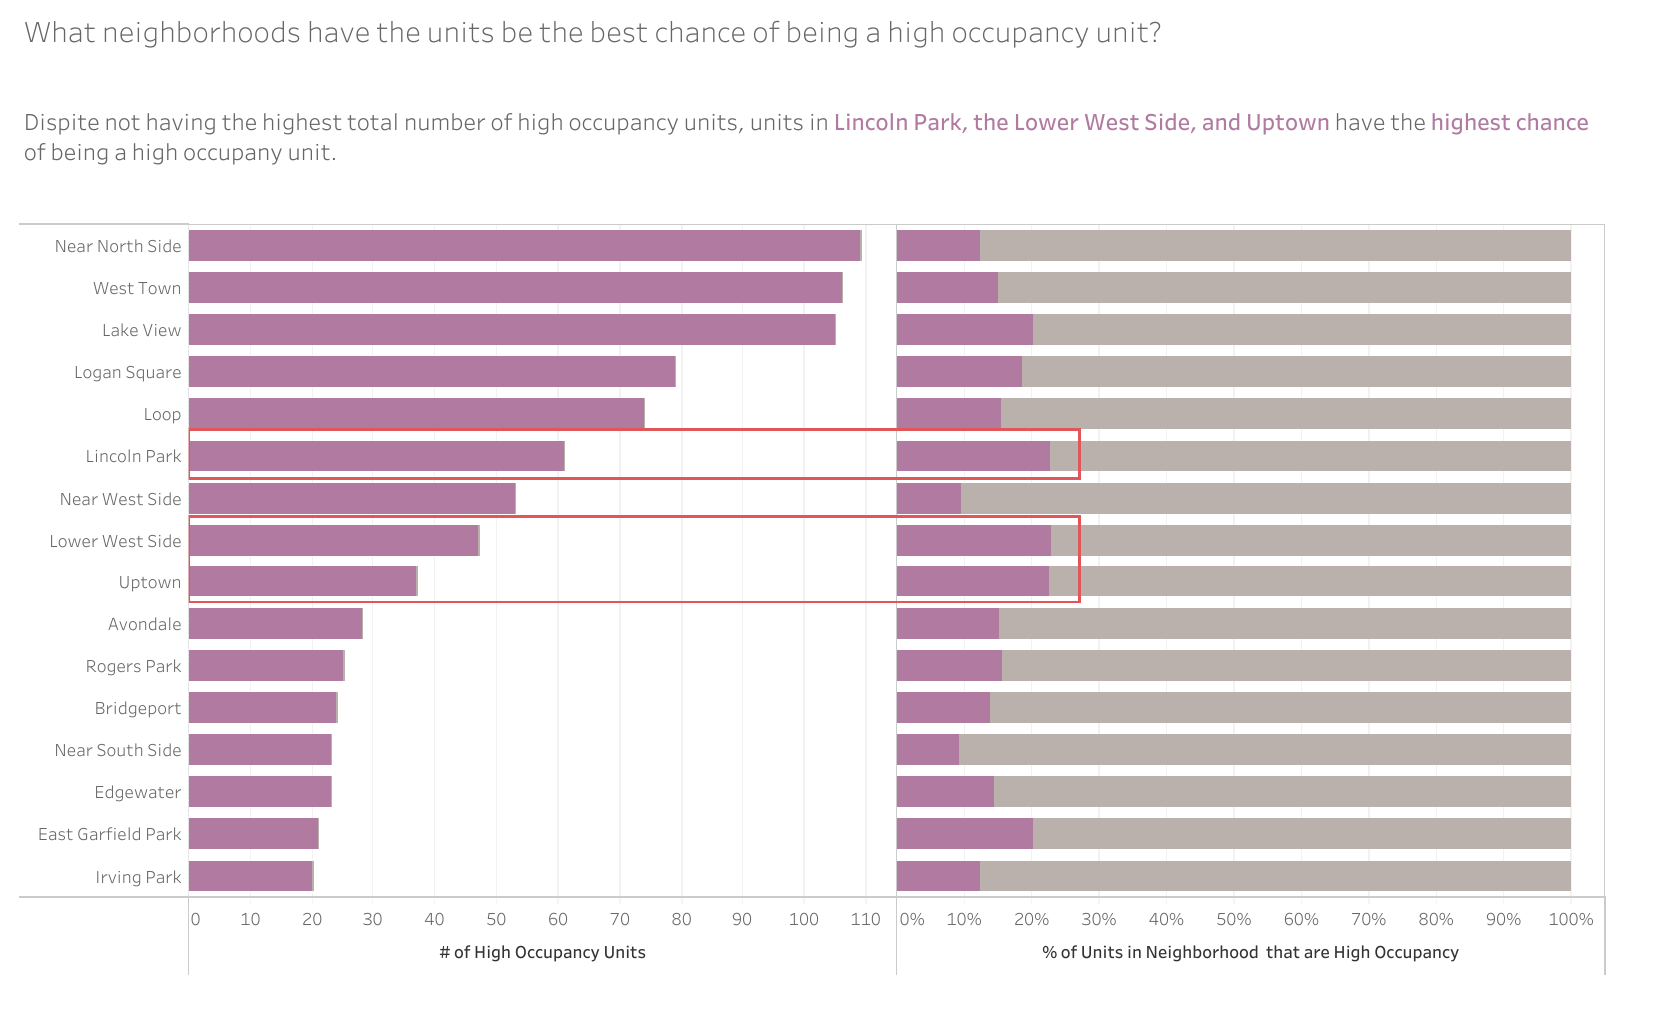
Total high-occupancy inventory and the probability of a listing being classified as high occupancy tell different stories.
Near North Side, West Town, Lake View, and Logan Square contain large numbers of high-occupancy units in the analyzed data.
However, proportional analysis highlights areas such as Lincoln Park, Lower West Side, and Uptown, where the share of listings classified as high occupancy is comparatively high.
Host Market Concentration
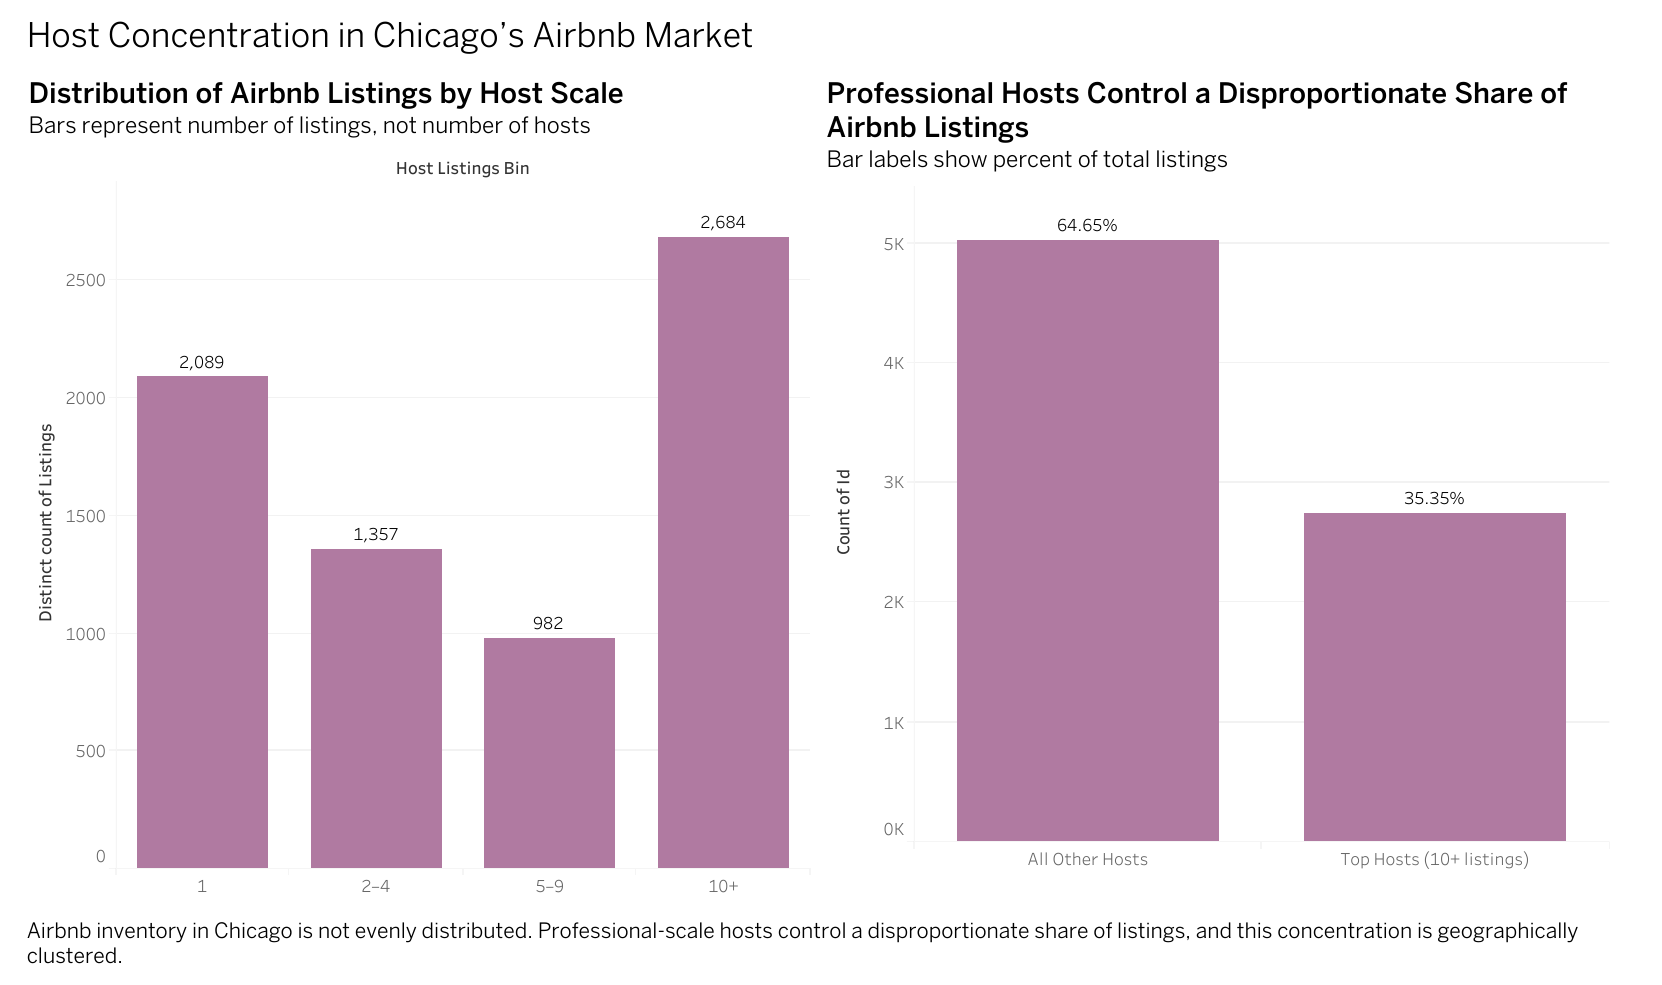
The analysis also examines how Airbnb inventory is distributed across hosts of different scales.
Listings were grouped by the number of properties associated with each host, allowing the market to be viewed across smaller hosts and professional-scale operators.
Professional-scale hosts represent a minority of host profiles but control a substantial portion of the Airbnb inventory represented in the dataset. This percentage represents the analyzed dataset, not the current Chicago market as a whole.
Where Professional Hosting Is Concentrated
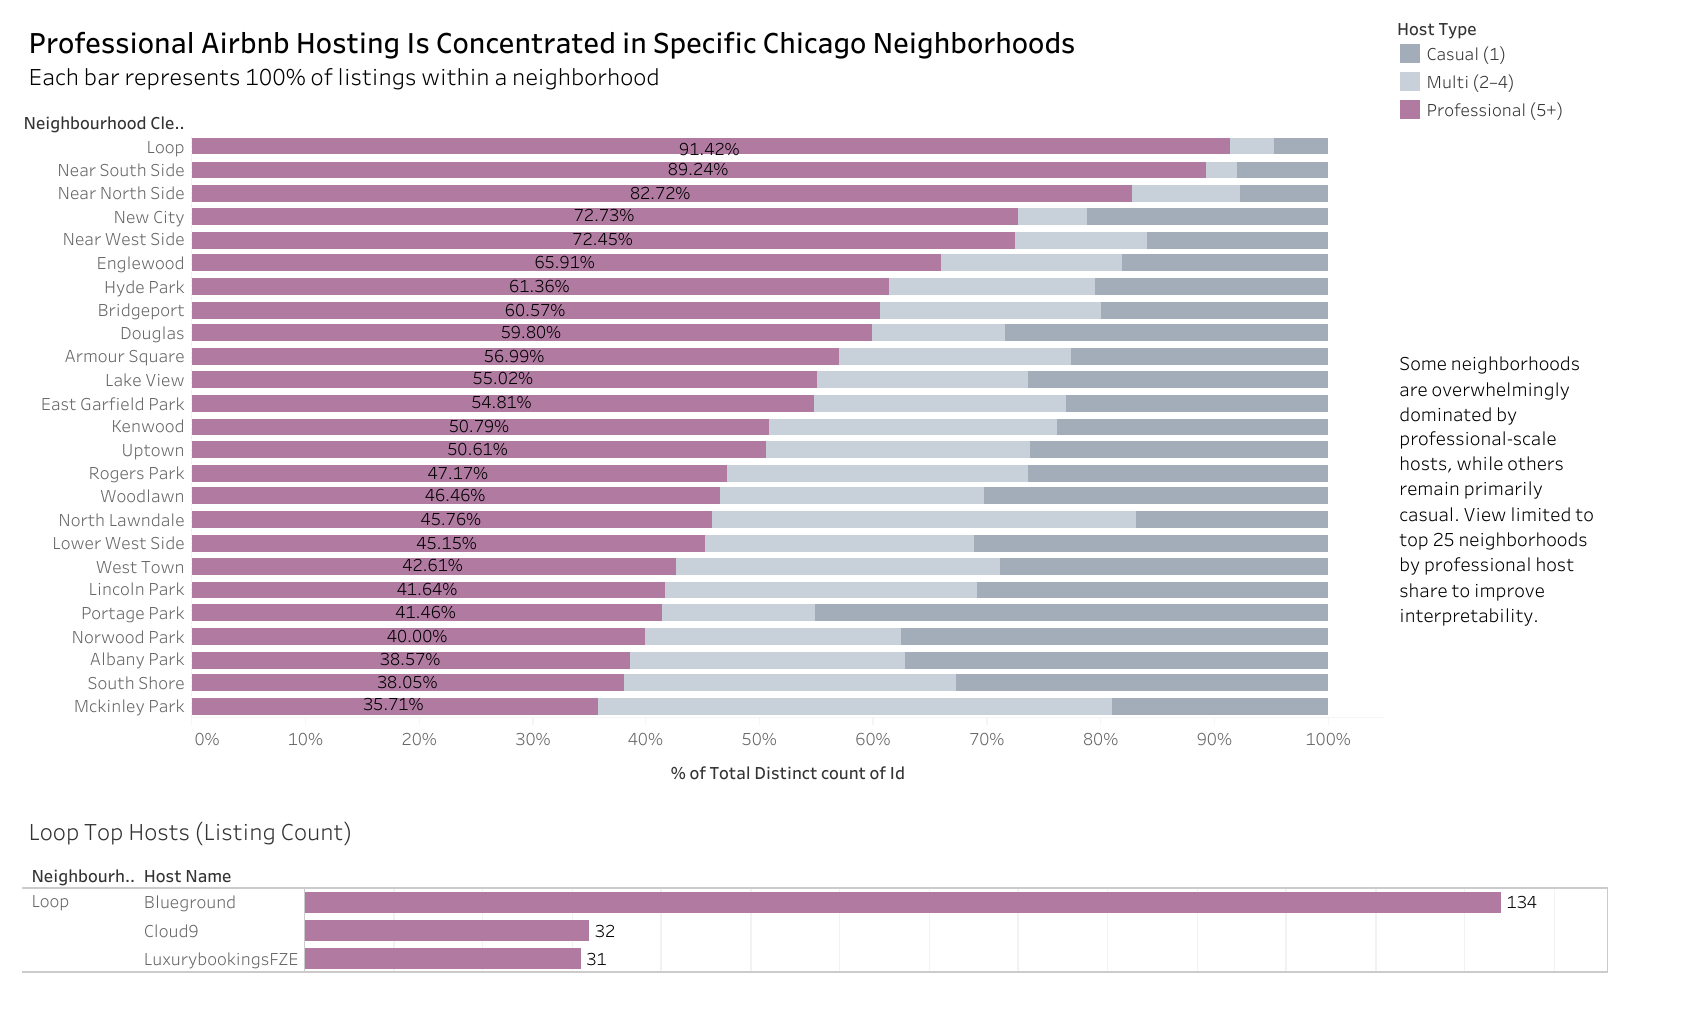
Host concentration also varies considerably by geography. The neighborhood analysis compares the composition of listings across casual, multi-listing, and professional hosts.
Several central Chicago neighborhoods show particularly high professional-host representation in the analyzed dataset.
The Loop provides a clear example: a relatively small number of large operators account for substantial listing inventory within the neighborhood.
Key Insights
Property Configuration Matters
Bedrooms and bathrooms are associated with higher prices, but pricing variability increases substantially among larger properties.
High Occupancy Is Not Simply About Size
The high-occupancy segment in the analyzed dataset is centered around relatively compact property configurations.
Geography Changes the Picture
Neighborhoods with the largest number of high-occupancy listings are not necessarily the neighborhoods with the highest proportional concentration of them.
Hosting Is Unevenly Distributed
Professional-scale operators control a meaningful share of the inventory represented in the analyzed dataset, with concentration varying significantly across neighborhoods.
Tools & Methods
Originally developed as a collaborative analytics project and adapted here as a portfolio case study.